You know what’s wild? Back in the day, they thought diseases were caused by bad air. Yep, miasmas! Imagine a doctor checking your pulse and blaming it all on the “stinky” breeze. Crazy, right?
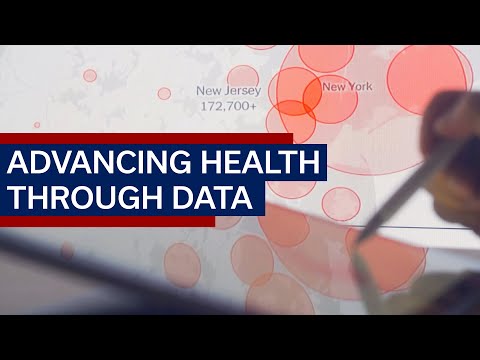
Now we have something way cooler: statistical epidemiology. It’s like detective work but with numbers. You can find patterns in health problems across populations, helping us figure out what’s going wrong before it gets out of hand.
Think about it: every time you read about a health issue in the news, someone’s crunched some serious data to back that info up. That’s epidemiology at work! It’s helping us make sense of why certain people get sick while others don’t.
So grab your favorite snack, and let’s unpack this fascinating world together. Because understanding how statistics play into public health is not just smart—it’s vital!
Enhancing Public Health Strategies: A Comprehensive Statistical Epidemiology Quizlet for Scientific Learning
Statistical epidemiology is like the backbone of public health strategies. It takes a deep dive into data to figure out how diseases spread, who gets affected, and what we can do about it. Basically, it’s all about numbers telling stories that can save lives.
When we talk about enhancing public health strategies, we’re looking at how these stats can help shape better programs and policies. Think of it this way: you wouldn’t bake a cake without a recipe, right? Well, public health needs its own “recipe” based on solid data.
One big component is understanding disease prevalence and incidence. Here’s what they mean:
- Prevalence: This tells us how many people have a disease at a certain time. Imagine you’re in a room with 100 friends; if 5 have the flu right now, then the prevalence is 5%.
- Incidence: This measures new cases over a specific period. So if 3 people catch the flu in a week, that’s your incidence rate for that timeframe.
These calculations are crucial for tracking outbreaks. For example, think back to early COVID-19 days when stats were flying everywhere! They helped governments understand where to focus resources—like where hospitals needed more beds or vaccines.
Another important point is risk factors. These are things that increase the chance of getting sick. Statistical epidemiology helps identify these by comparing affected and non-affected groups:
- If one group smokes more than another and has higher lung cancer rates, that’s a red flag.
- Or if people living in one neighborhood have higher rates of obesity due to limited access to healthy food—again, that matters.
Then there’s the whole issue of interventions. Once we’ve got all this data sorted out, what do we do with it? Well, different strategies come into play:
- Vaccination campaigns<!–: If data shows low vaccination rates linking to outbreaks, targeted campaigns can kick in.
- Health education programs: If statistics show rising diabetes rates among teens, schools might need educational programs on diet and exercise.
And let me tell you—real-life impacts of these strategies are often eye-opening! Like when smoking bans were enacted based on statistical evidence showing their effectiveness in reducing lung cancer cases over time.
So here’s where things get really interesting: surveillance systems. These systems gather ongoing data—which is super important for early detection of potential health threats. Think about how quickly we learned about different COVID variants; those surveillance systems were key in mapping out patterns and guiding responses.
And finally, there’s equity. Data allows public health officials to see where disparities exist among different populations. For example:
- If certain communities don’t have access to healthcare compared to others around them—this will show up in statistics!
- This means targeted resources are necessary so everyone has the same chances at being healthy.
In short, enhancing public health strategies through statistical epidemiology isn’t just smart—it’s vital! By understanding trends through numbers and narratives behind them, we can build healthier communities together. The next time you hear about public health initiatives or stats dissolving into your daily newsfeed—remember all this good stuff happening behind the scenes!
Enhancing Public Health Outcomes: The Role of Statistical Epidemiology in Effective Disease Management
So, let’s chat about how statistical epidemiology plays a crucial role in boosting our public health outcomes. It’s all about numbers and patterns, helping us understand diseases better and manage them effectively. You know, it’s like having a magnifying glass to look at the big picture.
Firstly, what is statistical epidemiology? Well, it’s essentially using statistics to study how diseases spread and affect different populations. This field helps researchers figure out **who’s getting sick**, **where**, and **why**. By analyzing data from various sources, we can identify trends that tell us a lot about health risks in communities.
Now, let’s dig into some key ways this works:
- Disease Tracking: Statistical epidemiology tracks disease outbreaks. For example, during the early stages of COVID-19, statisticians analyzed infection rates to predict how fast the virus would spread. This data was used to implement safety measures.
- Risk Factor Identification: Statistics help pinpoint risk factors associated with diseases. Say you have a group of people who all smoke; researchers can analyze their health outcomes compared to non-smokers to show that smoking increases the risk of lung cancer.
- Resource Allocation: Understanding where diseases are rampant allows health officials to allocate resources efficiently. Imagine if a certain area had a spike in flu cases; targeted vaccinations can be sent there.
- Policy Development: Data from statistical studies guides public health policies. Like with the recent obesity epidemic—studies have shown links between unhealthy food environments and weight gain, leading cities to create healthier eating initiatives.
- Predictive Modeling: By using past data, models can be created to predict future outbreaks or impacts of interventions. This was crucial for planning during the pandemic.
Now here’s something personal: I remember when my grandmother got diagnosed with diabetes. It wasn’t just her doctor saying she needed to change her diet; it was backed by studies showing how lifestyle factors contribute significantly to this condition among certain age groups! The stats made it real for us.
So you see, statistical epidemiology isn’t just a bunch of numbers in labs—it affects real lives every day! The findings help shape everything from individual treatments to large-scale public health campaigns.
But wait! It’s important to know that while stats are powerful tools, they’re not infallible. Misinterpretations can lead to panic or misinformation—like what happened with some vaccination misinformation during COVID-19.
In summary, statistical epidemiology enhances public health by providing crucial insights into disease patterns and impacts. As we continue navigating through various health challenges globally, having solid statistical foundations helps ensure that our responses are effective and informed. And remember—the more we understand these tools at our disposal, the better equipped we are for whatever comes next!
Enhancing Public Health Strategies: Insights from Statistical Epidemiology
Well, public health is like the big umbrella that keeps us all dry when a storm hits. You know, it’s not just about preventing illnesses but also about promoting overall well-being for everyone. Now, let’s talk about how statistical epidemiology plays a major role in this.
Statistical epidemiology is basically the science of using statistics to understand how diseases affect populations. It lets us dig into the patterns of health and illness in groups of people rather than just looking at individuals. So, imagine being able to track down the common cold and seeing where it spreads the most—like a detective piecing together clues!
Here’s where it gets interesting. When we collect data on health trends, we can identify risk factors. These are things that increase someone’s chance of getting sick. For example, if we notice that areas with lots of fast-food joints have higher obesity rates, it’s a huge hint that our eating habits might need some tweaking.
Another key point is using statistics to inform health policies. Decision-makers rely on solid data to create effective public health strategies. If they see spikes in flu cases during certain months, they might decide to launch vaccination campaigns ahead of time. This is like having a weather forecast for health threats!
Moreover, when you think about surveillance systems, they’re super important too! They collect ongoing data about diseases and can alert us if something unusual pops up—like an outbreak of measles in a specific community. Quick responses can save lives and prevent widespread panic.
Now let’s not forget about community engagement. Statistical evidence helps us communicate with communities more effectively. When folks see real numbers showing how smoking impacts lung health or how vaccination can cut down disease rates, they’re often more willing to participate in public health initiatives.
And here’s something personal: I once participated in a community survey related to seasonal allergies in my town. It was eye-opening to see how many neighbors were affected by pollen levels! This kind of engagement gives people a voice in their own health outcomes while feeding essential data back into the system.
In summary, combining statistical epidemiology with public health strategies creates this powerful toolset that helps keep communities healthy. By analyzing patterns and trends through data collection and making informed decisions based on those insights, we’re better equipped to handle health challenges head-on!
So yeah, whether it’s tracking diseases or crafting policies, statistical epidemiology is like having X-ray vision for public health—it shows us what needs fixing!
You know, it’s kind of amazing how many lives are influenced by something as seemingly dry as statistics. But seriously, the field of statistical epidemiology is like the unsung hero of public health. It’s behind the scenes, quietly gathering data and analyzing trends that can make or break our wellbeing.
Imagine a tiny town where everyone starts getting sick with something strange. Like when I was in college, one time my roommate caught this awful flu that spread like wildfire through our dorm. It was as if it snuck in through the cracks and took no prisoners! Well, folks over in public health would jump on that situation faster than you can say “sneeze!” They’d collect data on who got sick, where they spent time, and even what they had for lunch. That’s statistical epidemiology at work right there.
What really gets me is how these stats help us understand not just diseases but also behaviors and environmental factors that contribute to health issues. Think about it—by mapping out where cases of a disease cluster, you can find patterns that tell you whether it’s linked to bad air quality or poor access to clean water. It’s like solving a mystery, piecing together clues to figure out how to keep more people healthy.
But I gotta say, while numbers are crucial, there’s an emotional side too. Each statistic represents real people with hopes and struggles. You can’t forget that behind every data point is someone whose life could be turned upside down by a health crisis or a breakthrough intervention.
And let’s talk about prevention! With the insights gained from this work, communities can implement targeted programs: vaccination drives in hotspots or educational campaigns to raise awareness about hygiene practices. It’s crazy to think how much potential is packed into those spreadsheets and graphs!
Anyway, I guess what I’m trying to say is that statistical epidemiology isn’t just about crunching numbers; it’s about saving lives and empowering communities. That quiet number-crunching has the potential to revolutionize public health practices in ways we often take for granted. So next time you hear about some fancy research study or new health initiative based on stats—know there’s some serious thought and care behind it all!