You know, I once tried to impress a friend by explaining how climate change works. I ended up sounding like a human Wikipedia page, and let’s just say, my friend’s eyes glazed over faster than an overcooked pancake!
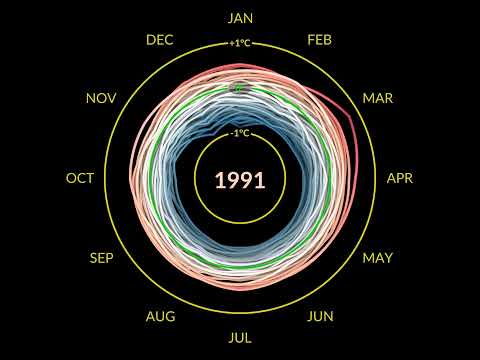
But the thing is, understanding climate change doesn’t have to be all doom and gloom. Just look at NASA’s Climate Spiral. Seriously, it sounds like something straight out of a sci-fi movie!
This cool visual really puts into perspective how our planet’s temperature has been shifting over the years. It’s like watching a rollercoaster ride but for Earth’s climate—twists, turns, and some pretty steep drops in there!
So let’s break it down together. What’s going on with our planet? And why should you care? Well, stick around, and we’ll explore the spiraling journey of climate change and what it means for all of us.
NASA’s Climate Spiral 2025: Unraveling the Future of Earth’s Climate Science
So, let’s chat about something that’s been making waves in the scientific community: NASA’s Climate Spiral. It’s a pretty neat visualization tool that tries to unravel what’s going on with our planet’s climate. Imagine taking a peek into a crystal ball that shows you how Earth’s climate is changing over time. Cool, right?
This tool uses a bunch of data from satellites and other observational technologies. It maps out temperature changes across the globe, kind of like a giant weather map but with a twist—looking at trends over years. You see colors spiraling as temperatures rise or fall, which represents the warming or cooling effect happening in different parts of the world.
So, what’s the big deal? Well, basically, we’re talking about some serious implications for our planet. The Climate Spiral helps us visualize how quickly things are changing. It isn’t just numbers and charts; it shows us what a warmer world might look like and how it affects everything from ice caps to forests.
- Polar Ice Melt: Regions like Antarctica are especially vulnerable. The spiral shows rapid temperature increases here, hinting that our ice caps are melting much faster than we thought.
- Extreme Weather: The data connects rising temperatures to an uptick in extreme weather events—think more hurricanes or intense heatwaves.
- Biodiversity Loss: As climates shift dramatically, many species struggle to adapt. This means we could lose some unique plants and animals forever.
The emotional side? Picture this: I still remember flipping through old photo albums of my hometown—lush green parks and vibrant wildlife. But fast-forward to today; I see dried-up lakes where kids used to play and birds that have migrated far away because their habitats changed too much. It’s alarming!
This is why understanding tools like NASA’s Climate Spiral is crucial—it gives us context for why all these changes matter—not just for scientists but for everyone living on this planet. And while numbers can feel overwhelming at times, seeing real-time visualization makes things more relatable.
The fight against climate change might feel daunting sometimes because it seems like such a big problem. But knowing what tools like this can do gives us hope! They help scientists make predictions and guide policies aimed at reducing emissions and creating sustainable practices.
In short, NASA’s Climate Spiral isn’t just about showing pretty colors on a map; it tells an important story about what’s happening right now and what we need to pay attention to as we move forward into the future of our planet’s climate science.
Exploring the NASA Climate Spiral 2024: Insights into Global Climate Changes and Atmospheric Trends
So, let’s talk about the NASA Climate Spiral for 2024 and what it means for our planet. This visual representation of climate data is pretty mind-blowing. It looks at changes in Earth’s temperature and atmospheric conditions over time, which can seriously help us grasp how our planet is changing. Every year, NASA gathers tons of data from satellites and weather stations to keep track of this stuff.
The Climate Spiral shows a gradual increase in global temperatures. You might have seen that iconic spiral that starts small and gets larger as it moves outward. Well, that’s showcasing how temperatures have risen over decades—like a snowball rolling down a hill, gaining momentum! You follow me? Basically, it emphasizes the urgency of understanding climate changes.
But it’s not just about heat waves; there’s more going on in our atmosphere. Here are some key points to consider:
- Rising CO2 Levels: Carbon dioxide levels are climbing, partly due to human activities like burning fossil fuels.
- Extreme Weather Events: More intense storms, droughts, and floods are happening more often these days. Remember that summer when everything seemed to get hotter? Yeah, you felt it too.
- Ocean Acidification: The oceans are absorbing excess CO2, which changes their chemistry and affects marine life.
- Melting Ice Caps: Glaciers are retreating at alarming rates—think about polar bears needing ice to hunt!
Each of these factors plays into the big picture of climate change. It’s like a big puzzle where all the pieces fit together but also show that something’s gone awry. I remember reading about how certain communities around the world are already feeling these impacts firsthand—a village that used to thrive now facing seawater intrusion because their land is literally disappearing.
Nobody’s pretending this is an easy fix; it’ll take global cooperation and innovative solutions to tackle this mess we’re in. But awareness is key! Tools like NASA’s Climate Spiral let us visualize these shifts and motivate action before it’s too late.
In short, the Nasa Climate Spiral offers a critical glimpse into how our atmosphere is evolving—and trust me—it’s essential for us all to pay attention!
Analyzing Global Temperature Anomalies: A Comprehensive Study from 1880 to 2024
Okay, let’s talk about global temperature anomalies and why they’re a big deal. Basically, a temperature anomaly is just the difference from an average temperature over a set period. When we’re looking at data from 1880 to 2024, we see some pretty wild changes happening on our planet.
You might be thinking: “What’s NASA’s Climate Spiral?” Well, it’s a visual representation of how the Earth’s temperatures have changed over the years. When you check it out, you can really see that things are heating up. In fact, if you look closely, you’ll notice that recent years are showing higher temperatures than in the earliest data!
Let’s break this down into some key points:
- The Basics: The world has gotten warmer since the late 19th century. The average global temperature has risen by about 1.2 degrees Celsius. That might not sound like much, but tiny shifts can have huge impacts.
- Data Collection: This data comes from thousands of weather stations across the globe. It gives us a clear picture of how different regions are experiencing these changes.
- The Trend: If you look at a graph plotting these anomalies, it resembles a steep hill climbing upwards since around 1975. This aligns with increased greenhouse gas emissions from human activities.
- The Implications: So what does this mean? Well, warmer temperatures can lead to more extreme weather events like hurricanes and heatwaves, which we’ve seen more of lately.
You know what’s kind of chilling? I remember watching the news one night when they reported on wildfires tearing through forests that had never burned before! It was heartbreaking to see nature so affected by rising temperatures and changing climates.
The thing is, scientists use models to predict what could happen next based on current trends. They think if we keep going at this rate without significant action against climate change, we could face some serious challenges—like rising sea levels threatening coastal cities or altering ecosystems in ways we can’t fully understand yet.
A big part of what makes this so pressing is that changes aren’t uniform everywhere. Some places may get hotter while others might experience unexpected cooling effects due to shifts in ocean currents or other factors. Seriously! Nature doesn’t always play by our rules.
As we look ahead toward 2024 and beyond, staying informed about these global temperature anomalies is crucial for everyone—from policymakers to everyday people trying to figure out how best to adapt and protect ourselves and our planet.
If you’re into learning about science and want to stay updated on climate issues, check out resources for regular updates—NASA’s got tons of info that dives deeper into all this stuff!
In short: Global temperature changes are real and happening fast! It’s something we should all keep an eye on because the future of our home depends on it—you feel me?
You know, the whole concept of NASA’s Climate Spiral is pretty eye-opening. It’s wild how something that sounds so technical can actually have such a personal reach. When I first came across it, I found myself staring at those spiraling graphs and animations, and my thoughts drifted to a day years ago when I was hiking with my family. We were in this beautiful forest, surrounded by massive trees and the smell of damp earth after rain. But even then, you could feel something wasn’t right; the trees looked a bit tired, like they were holding onto their last breaths.
So back to NASA’s Climate Spiral—it shows how global temperatures are changing over time, creating this visual representation of our planet heating up. Basically, the spiral illustrates rising carbon dioxide levels and global temperatures in a way that’s hard to ignore. It really hits home when you see red tones creeping in more and more every year.
It’s not just numbers; it’s our world changing before our eyes. You can almost feel that sense of urgency when you think about the implications—melting ice caps, rising sea levels… all that stuff can lead to serious consequences for wildlife and humans alike. Nature has its own way of balancing things out, but sometimes it feels like we keep pushing too hard against it.
And let me tell you about wildlife—while you’re out hiking or chilling at the beach, consider what animals are going through as their habitats change or disappear altogether. Imagine polar bears trying to find ice to rest on but encountering open water instead. That thought just kind of tugs at your heartstrings, doesn’t it?
I guess what I’m saying is it really makes you think about what we can do. Maybe it’s small changes like recycling more or using less plastic? Every little bit counts! The Climate Spiral serves as a reminder that our actions today shape tomorrow for everyone—and everything—sharing this planet with us.
So yeah, let’s keep our eyes open and maybe step up a little for Mother Earth. After all, she’s got our backs if we just take care of her too!