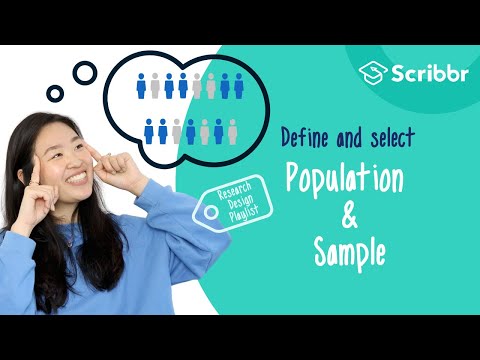
Alright, picture this: you have a giant bowl of M&Ms, right? Now imagine trying to guess how many of each color are in there without counting them all. You could just grab a handful and say, “Hey, I think there’s about 30 red ones in the whole bowl!” That’s kind of what scientists do with sample means.
So, you’re thinking, “What’s a sample mean? Is it like a fancy math term?” Well, it’s really just a way to take a little snapshot of something bigger. Imagine trying to figure out if your favorite pizza place has the best slices in town without eating every single pizza they’ve ever made. You’d take a few bites and say, “Yeah, this is amazing!”
That’s how researchers roll when they want to make sense of huge piles of data. They scoop up some samples and use those means to draw conclusions about the whole bunch. It sounds simple, but trust me—it gets pretty wild when you dig deeper. Ready to find out how this all works? Let’s chat!
Exploring the Role of Sampling in Scientific Research: Methods, Importance, and Applications
Sampling is like taking a small spoonful of soup to figure out how the whole pot tastes. You want to get a good idea of what’s going on without having to eat the entire bowl, right? Well, in scientific research, sampling helps us gather data that represents a larger population. Without it, studying everything would be impossible.
Why is sampling important? First off, it saves time and resources. Imagine trying to survey every student in a large university about their coffee preferences. It’d take forever! By using a sample—say 100 students—you can quickly get an idea of the overall preference trends among all students.
Now let’s talk about methods. There are different ways to sample, depending on what you need. Two common methods are:
- Random sampling: Everyone in the population has an equal chance of being selected. It’s like pulling names from a hat.
- Stratified sampling: The population is divided into subgroups (or strata), and samples are taken from each group. This can help ensure that specific groups are adequately represented.
For example, if you’re studying health behaviors across different age groups, stratified sampling would make sure all ages are represented fairly.
Now, let’s zoom in on sample means. The sample mean is basically the average value from your data set. It’s crucial because it gives researchers a snapshot of what’s happening within their sample and helps them make inferences about the larger population. But here’s where it gets tricky: if your sample isn’t representative, your conclusions might be way off!
I remember working on this project where we surveyed only students from a specific major about their study habits. Turns out, their experiences really differed from those majoring in other fields! We realized our findings didn’t reflect the whole student body at all—oops!
In terms of applications, scientists use sampling everywhere: public health studies often rely on survey samples; environmental researchers may take soil samples from select locations; even election polls use samples to predict outcomes based on voter preferences.
So there you have it! Sampling plays an essential role in scientific research by helping researchers gather insights efficiently while ensuring that they can draw valid conclusions. Just remember: whether you’re scooping soup or gathering data, getting that representative taste is key!
Top 5 Reasons for Sampling in Scientific Research: Enhancing Validity and Efficiency
Sampling is like taking a snapshot of a whole big picture, you know? When scientists want to make claims about a large population, it’s often just not feasible to study every single individual. So, let’s dig into why sampling is super important in scientific research, especially when it comes to boosting the **validity** and **efficiency** of findings.
1. Cost-Effectiveness
First off, sampling can seriously save money and time. Imagine conducting a study on the eating habits of all college students in your country. That would take forever and cost a mountain of cash! By choosing a smaller group (the sample), researchers can cut down expenses while still getting valuable insights. It’s like trying a slice of pizza before deciding to order an entire pie; you get the taste without going all-in.
2. Manageable Data Collection
Next up: managing data. It’s tough to handle mountains of data from every person in a large population—like tackling an avalanche with just a shovel! But with sampling, researchers can focus on gathering data systematically from their selected group, making the analysis way more doable and organized. You basically get to focus on quality over quantity.
3. Enhanced Speed of Research
Then there’s speed. In research, being quick can be essential, especially if someone is waiting for results that could affect public health or policy decisions. Sampling helps scientists gather their findings faster by limiting the number of participants they need to engage with for conclusions that are still reliable.
4. Representativeness
Now let’s talk about representativeness. A good sample reflects the larger population it comes from — think of it as picking blueberries from one bush instead of scouring the entire field! If you randomly select your sample correctly, it’ll likely mirror the diversity found in the whole group, which means your results will be more generalizable.
5. Statistical Analysis Power
Finally, sampling boosts statistical power! In simpler terms, smaller samples can actually yield clear insights if they’re chosen wisely and analyzed properly. Researchers use statistical methods to draw conclusions from these sample means that help them assess trends or effects across broader populations without needing every single data point from everyone!
So there you have it! Sampling not only enhances validity and efficiency but also makes scientific research leaner and meaner—just like choosing what toppings go on your pizza before baking that big ol’ pie! By capturing key characteristics through smart sampling strategies, scientists can ensure their findings are both relevant and responsible.
Understanding the Sample Mean in Scientific Research: Key Concepts and Applications
So, let’s chat about the sample mean. It’s one of those things in science that pops up all the time, but what does it really mean? Basically, the sample mean is just the average of a group of data points you collect in a study. So if you’re measuring something like plant growth or test scores, you’d gather some data from a smaller group instead of looking at everything.
Think of it like this: if you want to know how your friends feel about a new movie, asking just one or two might not give you the full picture. But asking a bunch gives you a better idea. Right? That’s exactly how scientists use sample means to draw conclusions from limited data.
Now, why do we care about this? Well, using sample means helps researchers make inferences about larger populations without needing to measure everyone. Imagine trying to survey all college students in your country—yikes! Instead, scientists take samples and calculate their means to understand trends and behaviors.
Here are some key concepts related to sample means:
- Population vs. Sample: The population is everyone you’re interested in studying; the sample is just a little piece of that pie.
- Random Sampling: To make sure your data accurately represents the population, it’s important to pick samples randomly. This way, every individual has an equal shot at being included.
- Standard Deviation: This tells us how spread out our data points are around the mean. A small standard deviation means most of your data points are close to the average; a larger one means they’re scattered.
- The Central Limit Theorem: This fancy term basically says that if you take enough samples and compute their means, those means will form a normal distribution (you know, that bell curve) regardless of how your original data is shaped.
Let’s say you’re studying how well students perform on math tests after different study methods. If you have five classes worth of students but can’t test all 150 kids, you might select 30 randomly from those classes to find out their average score. That average score is your sample mean.
But it gets even cooler! You can use this sample mean in statistics for things like hypothesis testing. So if you’re trying to determine whether kids who study with flashcards do better than those who study online videos, comparing their average scores will help you figure it out!
And here’s where emotions come into play—think back on when I tried out for my school play and didn’t get in initially. I remember feeling bummed seeing my friends celebrating their roles. Then I saw that their success could be tied back to several factors: practice time, support from family… kind of like collecting samples from different backgrounds led them there! It all relates back once again; looking at averages gives insight into broader trends.
So yeah, understanding sample means lets scientists confidently generalize findings about populations without needing infinite resources or time—just some solid sampling techniques and calculations! As research continues evolving with new technologies and methods popping up everywhere—it’ll be interesting to see how these age-old concepts adapt too!
When you think about scientific research, one common element pops up again and again: sample means. It’s like the backbone of so many studies. Imagine you’re at a party, and a friend is trying to gauge how much people are enjoying the music. Instead of asking everyone—because, let’s be honest, who has that kind of time?—they ask just a handful of people. They take those responses and use them as a representation of the whole crowd’s vibe. That’s a bit like what scientists do with sample means.
So here’s the thing: sample means are super useful because they help researchers summarize data quickly. They allow us to find trends or differences without sifting through heaps of numbers. But it gets tricky! If your sample isn’t representative—like if you only ask your closest friends about their music taste—you might end up with a seriously skewed view.
I remember doing this project in school where we had to survey classmates about their favorite ice cream flavors. Everyone was gung-ho about chocolate, but then I realized I’d only asked my friends who all happened to love it too! It was only when I got out there and asked people from other classes did I find out that vanilla was actually the crowd favorite. Lesson learned!
Also, it’s not just about getting a random chunk of data to crunch on. You gotta think about how big your sample is too! A tiny group might give you a rough idea but could easily mislead you if you’re trying to draw big conclusions from what they say.
That’s why researchers often talk about “confidence intervals” when sharing their findings—they’re kinda saying, “Hey, based on our sample mean, we feel pretty good that the true mean (for the entire group) is somewhere in this range.” It’s like covering your bases and saying there might be some wiggle room in what those numbers really mean.
In essence, while sample means are essential for making sense of data and forming conclusions in research, they come with their own baggage. And realizing that—that sometimes our quick snapshots may not tell the whole story—is super important as we navigate through scientific findings. So next time you hear someone throw around those average figures, remember there’s often more hiding behind them!