You know that feeling when you have a bunch of numbers staring back at you, and they’re just all jumbled up? Yeah, I totally get that! I mean, it’s like trying to find your favorite sock in a messy drawer.
So, imagine you’re knee-deep in some scientific research. You’ve collected loads of data, but now what? This is where the median steps in, like your organized friend who helps you clean up that drawer.
Calculating the median for grouped data might sound fancy, but seriously, it’s not as complicated as it seems. It’s all about finding that middle ground among a bunch of numbers—and hey, sometimes that’s exactly what we need to make sense of our research!
Let’s break it down together. It’ll be fun!
Calculating the Median of Grouped Data: A Comprehensive Guide for Scientific Analysis
You know when you have a bunch of data, maybe from some survey you did or an experiment, and you want to find that middle value? That’s where the median comes in. It’s pretty handy for understanding your data, especially with grouped data, which is just data organized into ranges or categories.
Okay, so let’s break this down. The median is essentially the number that separates the higher half from the lower half of your data. When you’re dealing with grouped data, it’s not as straightforward as just picking a middle number from a list. Instead, you’ve got to do a bit more work.
Here’s how it usually goes:
- Organize Your Data: First off, you need your data in groups or classes. Like if you’re looking at test scores and you’ve got ranges: 0-10, 11-20, and so on.
- Find the Cumulative Frequency: You then calculate how many observations fall within each group. This helps you see where most of your data points are.
- Identify the Median Class: To find this class where your median lies, figure out how many total observations you have (N). The median will be at position N/2. Let’s say you’ve got 50 scores; you’d look for the 25th score.
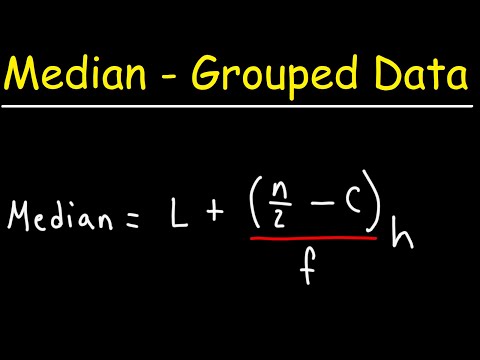
- Use the Median Formula: Once you’ve identified that median class (let’s call it Group M), use this formula:
Median = L + [(N/2) – CF]/f * c
Where:
- L = lower boundary of the median class
- CF = cumulative frequency of class before median class
- f = frequency of the median class
- c = class width (size of each group)
Now let’s say we’re working with test scores grouped as follows:
- 0-10: 2 students
- 11-20: 5 students
- 21-30: 12 students
- 31-40: 18 students
You can add these up to find there are **37** students total. So N/2 would be about 18.5—meaning our median is in the **31-40** range.
Now we plug into our formula:
- L = 30 (since we take the lower end of this range)
- CF for previous classes = 19 (because it accumulates from all frequencies before it)
- f (the frequency of our current medium group) = 18
- c (the size of each group here) = 10
So filling those into our equation looks like this:
Median = 30 + [(18.5 – 19)/18] * 10
After some math magic—getting a decimal—and maybe some rough calculations—you can figure out that your final value might hover around **35**, depending on how precise your calculations get.
It can feel like a lot at first glance but stick with it! Like riding a bike or learning to bake cookies—sure, it seems tricky at first until it all clicks together and starts making sense.
When scientists use medians in research analysis instead of averages, they often get a better picture—especially when their data has outliers or isn’t symmetrically distributed. It helps prevent those crazy high or low values from messing everything up!
So next time you’re looking at some grouped data in science or even just organizing some numbers for fun—you know how to find that perfect middle spot!
Calculating Median in Research Methodology: A Guide for Scientific Analysis
When it comes to analyzing data in research, calculating the median is a key step. The median is basically the middle number in a sorted list of numbers. So, if you think about it like this: if you have a group of friends and you want to figure out who’s right in the middle based on their heights, the median gives you that answer. It’s not just a cool math trick; it’s super useful for understanding your data better.
Calculating the median for grouped data is slightly trickier than just lists of numbers. You’re probably dealing with ranges instead of specific values. For example, let’s say you have height ranges like this:
To find the median in grouped data, follow these steps:
1. **Identify the total number of observations**: First off, you need to know how many data points you’re working with. Let’s say your groups have these frequencies:
So, that adds up to a total of 28 people.
2. **Find the cumulative frequency**: This means adding up the frequencies as you go along. It looks like this:
- Cumulative for 150-160 cm = 5
- Cumulative for 161-170 cm = 5 + 8 = 13
- Cumulative for 171-180 cm = 13 + 12 = 25
- Cumulative for 181-190 cm = 25 + 3 = 28
3. **Locate the median class**: You want to find out which group contains your median value. Since there are 28 values, look for the position at ( frac{N +1}{2} ), which would be ( frac{28 +1}{2} =14.5 ). So here, you’d be looking at where this falls within your cumulative frequency.
4. **Determine which interval covers your value**: Since the cumulative frequency reaches up to 13 in the second class and jumps to 25 in the third class (171-180), your median class is indeed **171–180 cm** because it contains that middle value.
5. **Use those findings to calculate it**: Now here’s where it gets slightly mathematical but hang tight! You’ll use this formula:
( Median = L + left( frac{frac{N}{2}-CF}{f} right) * c )
Where:
– L = lower boundary of median class (171 in this case)
– N = total number of observations (28)
– CF = cumulative frequency before your median class (13)
– f = frequency of median class (12)
– c = width of class intervals (in this case let’s assume each range spans from x to y so it’s generally consistent)
So plugging those numbers into our formula gives us something like:
( Median ≈ L + (frac{14-N}{f}) * c ).
Now just crunch those numbers!
Calculating medians from grouped data isn’t just math homework; it provides insights into trends and distributions that can shape your understanding of whatever you’re studying—be it populations, temperatures over time or anything else!
Hopefully, this helps demystify finding medians from grouped information! If nothing else sticks from all this math talk, remember that being able to pinpoint where that middle ground lies empowers you as a researcher. Happy analyzing!
Calculating the Median: A Step-by-Step Guide Using Science-Based Methods
Calculating the median might sound like math homework, but it’s actually super useful in scientific research. I mean, think about it: when you gather data, you often want to know the middle value. That’s where the median comes into play. The median is like a high-five in data form—it helps you understand where most of your data lands without being skewed by outliers.
So, let’s break it down step by step. If you have a set of numbers, say test scores from a science class, finding the median is pretty straightforward. However, with grouped data—like ages of participants in a study or temperature readings—you’ve got to take a few extra steps.
First off, what is grouped data? It’s basically when you have intervals instead of individual values. For example, if you recorded how many people fall into specific age ranges (like 0-10 years, 11-20 years), that’s grouped data.
Here’s how to calculate the median for grouped data:
Step 1: Set up your frequency table. You’ll need to create a table that lists your intervals and how many observations fall into each one.
- Example: Let’s say in your study you have:
- 0-10 years: 5 people
- 11-20 years: 10 people
- 21-30 years: 15 people
- 31-40 years: 8 people
Step 2: Calculate cumulative frequencies. This step helps to see how many observations fall below each interval.
- Cumulative frequency:
- 0-10 years: 5 (just itself)
- 11-20 years: 5 + 10 = 15
- 21-30 years: 15 + 15 = 30
- 31-40 years: 30 + 8 = 38
Step 3: Find the total number of observations. Just add up your frequencies from Step 1.
- Total:: Going back to our example from before:
– Total number of people = 38 (5+10+15+8)
Step4: Determine which group contains the median.
Now that you’ve got your total (in this case, it’s **38**), find out what half that is—just divide by two! So for us:
- N/2::
– N/2 = **38/2** = **19**.
Now look at your cumulative frequencies and see where that number falls. In our example:
- Cumulative Frequency for age groups are:
– For **0-10**, cumulative is **5**.
– For **11-20**, cumulative is **15**.
– For **21-30**, cumulative is **30**.
– So our median falls in the **21-30** interval because that’s the first one with a cumulative frequency greater than or equal to **19**!
The next steps?
You’ll need some more numbers from that interval—the lower class boundary and the frequency of that group. Let’s say for our “21–30” group:
- <
- L:: Lower boundary = **21**.
- Nf:: Frequency of this group = **15**.
<
Now we use these values in the formula:
Mediann = L + [(N/2) – C] / f * w , where:
- <
- L= lower boundary of median class (which was ***21***).
- Nf= total number of observations (***38***).
- C= cumulative frequency before this class (**Nf=15**) .
- w= width of the intervals (**10**, since we’re going from ***21–31***).
Putting all this into action:
So plug those numbers into your formula:
Median = `L + [(N/2) – C] / f * w`
=> Median = `21 + (19 –15) /15 *10`
=> Calculate what’s inside first
=> (4 /15) *10 => approx `2.67`Then add it up:
=> Median ≈ `23.67`.That means about half your subjects are under ‘23.67’ years old! Super easy right?
And there you go! You’ve just calculated the median from grouped data like a pro! It’s all about keeping it organized and breaking things down bit by bit—you totally got this!
Alright, let’s chat about calculating the median for grouped data in scientific research. Just to set the stage, the median is that sweet spot where half your data points lie below it and half are above. It’s like the middle child that doesn’t get much attention but is super important in understanding your data.
Now, when you deal with grouped data—which is basically when you’ve organized your data into ranges instead of individual points—things can get a little tricky. So, think about it this way: let’s say you’re a teacher and you just graded a bunch of tests. Instead of looking at each score individually, you group them into ranges like 0-10, 11-20, and so on. It makes life easier but also means some details are lost.
Here’s where you come in like a detective trying to figure out where that median lies amidst all those ranges. First off, you’ve got to find the cumulative frequency for each group, which means keeping track of how many scores fall within each range as you move up the list. Pretty straightforward, right?
When you finally find out which group contains the median—like if it’s sitting smuggly in the 21-30 range—you still can’t just grab it and call it a day. Oh no! You need to interpolate. What does interpolation mean? Well, it’s just a fancy way of estimating where that median really sits within that group based on how many scores are in there compared to what’s on either side.
It kinda reminds me of when I was trying to squeeze my way through a crowded concert venue. You can’t just shove yourself past everyone; you’ve got to navigate around and estimate how far you’ve moved forward based on where people were before!
So yeah, what happens here is that calculating the median for grouped data isn’t just about taking an average or pinpointing a number; it’s more about understanding the distribution of your data as a whole. It helps researchers grasp trends or shifts without getting bogged down by every single detail.
And honestly? That deeper insight into how your data behaves makes all this math worth it. You’re not just crunching numbers; you’re telling stories with your findings! And every once in a while, those stories reveal something unexpected—like finding out that most students actually bombed that test when you thought they aced it! So grab those ranges and dig in; there’s always something interesting lurking beneath the surface!