You know that feeling when you try to prove a point but end up with, like, a million conflicting opinions? It’s like asking your friends to pick a favorite pizza topping. Everyone’s got their own idea of what’s best!
Well, science deals with this kind of chaos too. Imagine trying to figure out if a new drug actually works or if it’s just people’s hopes talking. It’s where statistical testing comes in—like the ultimate referee in an epic pizza debate!
You might think, “Statistics? Ugh!” But hang on a second. It’s not all just numbers and formulas. This is about making sense of messy data and finding what’s real versus what’s just noise.
Trust me; it can be wild how often we rely on these tests and how they shape what we believe is true. So let’s dig into this world of statistical testing and see how it unveils reliable results—or sometimes, leaves us hungry for more answers!
Understanding Statistical Tests for Assessing Reliability in Scientific Research
When you dive into the world of scientific research, you’ll often bump into something called **statistical tests**. You might wonder, “What’s the deal with those?” Well, they’re tools scientists use to make sense of data. Basically, they help researchers figure out if the results they got from their experiments are legit or just a fluke.
So imagine you just conducted a study on how coffee affects alertness. You have two groups: one drinks coffee, and the other sips on decaf. After some testing, you find that the coffee drinkers performed better on a math quiz. But was that difference real? That’s where statistical tests come into play.
Reliability in research is crucial. It means you can trust that your findings aren’t due to random chance. That’s why scientists often use different statistical tests depending on the nature of their data:
- T-tests: These test if there are significant differences between two groups—like our coffee versus decaf example.
- ANOVA: When comparing more than two groups, like testing different types of caffeinated drinks (espresso, latte, or energy drinks), ANOVA is your go-to!
- Chi-square tests: These assess relationships between categorical variables. If you wanted to see if gender influences coffee preference, this test would be useful.
- P-values: This little number tells you whether your results are significant (usually P
Let me share a quick story here. A buddy of mine once conducted an experiment about plant growth under different light conditions. He thought he’d found something groundbreaking when one plant grew taller under blue light compared to red light. After running some statistical tests—good old ANOVA—the results showed it wasn’t significant at all! Turns out, his measurements were off due to not accounting for variations in water and soil type! So it’s super important to get it all right.
The power of a test is another thing to keep in mind. It’s like the strength of your study; higher power means you’re more likely to detect an actual effect if there is one. This usually has to do with sample size—more data leads to better results.
Statistical reliability isn’t just numbers and formulas; it impacts how scientists communicate their findings too! When researchers publish papers, readers depend on these statistical analyses to understand if they can trust the conclusions drawn.
If you’ve ever seen research articles filled with charts and graphs and thought “what’s up with all these numbers?”, remember—they’re trying really hard to make sure their discoveries are robust.
So here we go: statistical tests help us understand our research better and communicate findings effectively! Pay attention when reading studies; those pesky p-values and test types tell a million stories behind mere words.
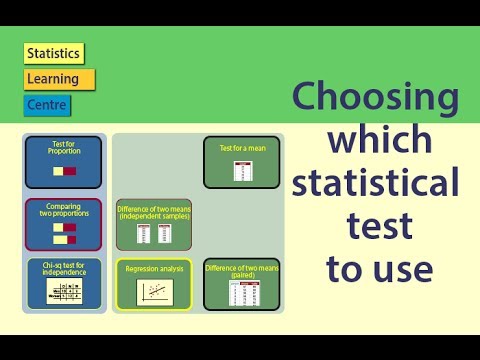
Choosing the Optimal Statistical Test for Predicting Outcomes in Scientific Research
So, you’re diving into the world of statistical tests, huh? It’s a crucial part of scientific research that helps you make sense of your data and draw reliable conclusions. Picking the right test can feel like navigating a maze sometimes, but once you get the hang of it, it becomes easier.
First off, let’s talk about **what kind of data** you have. Statistical tests generally fall into two main categories: **parametric** and **non-parametric tests**. Parametric tests assume that your data is normally distributed. This means that if you were to graph it, you’d see that classic bell-shaped curve. If your data doesn’t fit this pattern or is categorical (like yes/no responses), then non-parametric tests are usually the way to go.
Another thing to think about is whether you’re comparing groups or looking at relationships between variables. For example:
If you want to compare two groups:
- The t-test is great for comparing means between two groups when your data meets parametric assumptions.
- If your data isn’t normal, go for the Mann-Whitney U test. It does pretty much the same job without those assumptions.
If you’re looking at more than two groups:
- The ANOVA test lets you compare the means across three or more groups.
- Again, if normality is an issue, consider using the Kruskal-Wallis test.
Now let’s say you’re trying to find out how one variable influences another—this gets a bit more complex but still totally manageable.
For correlations between two continuous variables:
- Pearson’s correlation coefficient tells you how strongly two variables are related if both follow a normal distribution.
- If not, try using Spearman’s rank correlation coefficient, which doesn’t assume normality.
Alright, so maybe you’ve got multiple independent variables impacting a dependent one—classic regression scenario! You might use:
- Linear regression
- If things aren’t neat and tidy (you know what I mean), then consider logistic regression for binary outcomes.
But here’s where it gets cool. Understanding your sample size matters too! Smaller samples can lead to misleading results because they might not represent the whole population.
Imagine being in a lab working late one night and realizing that all your hard work could be derailed by one tiny mistake in choosing the wrong test! It’s like baking a cake without checking if you’ve actually got sugar instead of salt—yikes!
Lastly, always remember to think about **the assumptions behind each test** before deciding which one to use. Each statistical method has its own set of rules regarding things like sample size and variance homogeneity.
In short, picking the right statistical test isn’t just important; it’s essential for ensuring your research holds water. Just take time to understand your data and what you’re actually trying to measure—you’ll be just fine!
Understanding Statistical Tests: Comparing Observed vs. Expected Results in Scientific Research
When we look at scientific research, one of the big challenges is figuring out whether what we see in our results is actually significant or just random noise. This is where **statistical tests** come into play. They help us compare what we actually observe during experiments to what we would expect to happen under certain conditions.
So, let’s break this down a bit. Imagine you’re tossing a coin. You expect it to land on heads about half the time and tails the other half, right? If you toss it ten times and get heads seven times, you might start scratching your head, thinking, “Is this normal?” Here’s where statistical tests can help.
Statistical tests are basically a way of asking: “Is this observation likely due to random chance?” or “Does it suggest something more?” The key element here is comparing observed results (the actual outcomes) with expected results (what would happen if everything was functioning as usual).
Now, let’s get into some terms that pop up often:
- Null Hypothesis: This is the starting point for statistical testing. It usually says that there’s no effect or no difference between groups. For example, with our coin flips, the null hypothesis would be that heads and tails have an equal chance of appearing.
- Alternative Hypothesis: This suggests that there *is* an effect or a difference. In our coin case, it could say that one side is favored.
- P-value: This tells you how likely you’d see your observed results if the null hypothesis were true. A smaller p-value means stronger evidence against the null hypothesis.
Let’s say after your coin tosses you calculate a p-value of 0.08. That means there’s an 8% chance those results came from random luck under the null hypothesis assumption. If your threshold for significance was set at 0.05 (5%), then you’d conclude that those extra heads are likely just randomness and not something unusual.
One challenge in science is choosing the right test for your data type and research question! There are many types out there – t-tests, chi-square tests, ANOVA… they all serve different purposes based on how your data looks.
For instance:
– If you’re comparing averages between two groups (like test scores before and after a study method), a **t-test** might be used.
– If you’re looking at categorical data (like boys vs girls choosing red or blue candy), then perhaps a **chi-square test** would fit better.
Another important piece of this puzzle is understanding **effect size** along with statistical significance. Sometimes even if a result is statistically significant—meaning it crosses that p-value threshold—it might not be practically important in real life! Like winning by just one point in a game doesn’t really reflect how well teams played overall.
So think of statistical testing as having two parts: comparing what you’ve seen versus what you’d expect based on certain assumptions while also considering how meaningful those findings truly are.
Realizing these distinctions allows researchers to get better insights from their data and helps other researchers avoid over-interpreting small differences as significant findings—not always easy when emotions run high after lots of hard work!
In summary, statistical tests are valuable tools in helping us understand what our research truly reveals about nature versus mere chance—a bit like deciphering signals from static in radio waves!
Statistical testing is one of those things that can feel a bit like a secret language, you know? If you’re not deep into the sciences, it might sound intimidating. But really, it’s all about making sense of the chaos around us. Think of a time when you tried to find out if your new recipe was actually better than your grandma’s famous dish. You wouldn’t just rely on your taste buds, right? You’d want to give it a real test—maybe have a bunch of friends try both and see which one they prefer. That’s kind of how statistical testing works in science!
Basically, when scientists are looking for reliable results, they need to figure out whether the differences they see in their experiments are significant or just due to chance. It’s like tossing a coin and wanting to know if it’s fair or biased. If you flip it ten times and get heads every time, you’d start to wonder if something fishy is going on! Here’s where statistics come in to save the day.
Remember in school when we learned about averages? Well, statistical tests take that concept further. They allow researchers to analyze data and make decisions based on probabilities. It sounds pretty dry, but think about how much easier our lives would be without it! Imagine doctors prescribing treatments without knowing if they actually work—yikes!
I remember once chatting with a friend who was trying to convince me about this wild new diet that the internet raved about. He shared a “study” claiming incredible weight loss results, but when we dug deeper, we found out they didn’t really do any proper statistical analysis! It hit me then: without those rigorous tests, anyone could throw around claims like confetti.
So here’s the deal: statistical tests help scientists sift through mountains of data and cut through noise. They give us tools like p-values and confidence intervals—fancy terms that help gauge whether or not what we’re seeing is real or just coincidence. The best part? This process can lead us toward discoveries that change lives!
It’s heartwarming when you think about how much effort goes into ensuring results are reliable before sharing them with the world—researchers sacrificing sleep (and stressing over their p-values) so that what comes out can actually be trusted by everyone else.
In short, while statistical testing might seem convoluted at first glance, it’s crucial for making sure scientific findings aren’t just lucky guesses. It’s all part of this grand adventure called science where every little piece matters—and that’s kind of exciting!