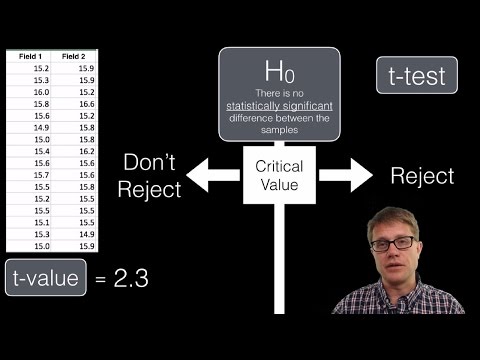
You know that moment when you decide to bake cookies, but you realize you’re missing half the ingredients? Yeah, it’s like trying to figure out if your cookie recipe actually works without tasting the dough first.
That’s where the t-test struts in, like a superhero of statistics! It helps researchers figure out if their results are legit or just a fluke.
So, whether you’re measuring how plants grow with different fertilizers or testing new meds, this little test is a big deal. Basically, it tells you whether any differences in your findings are real or just random chance messing with your head.
Sounds cool, right? Let’s unpack this and see how scientists use it to make sense of their experiments.
Understanding the T-Test: Essential Statistical Tool for Scientific Research
Sure thing! Let’s talk about the t-test—it’s a statistical tool that you’ll see popping up a lot in scientific research. It’s kind of like that trusty Swiss army knife you keep around; really handy when you need it.
To start, what is a t-test? Well, basically, it’s a way to compare two groups of data to see if they’re significantly different from each other. Imagine you’re testing a new fertilizer on plants and want to know if they grow taller compared to those that didn’t get the special treatment. That’s where the t-test comes into play!
Types of T-Tests
There are mainly three types of t-tests that scientists use:
The Calculation
Now, let’s get into the nitty-gritty part: how do you actually calculate this? The formula looks like this:
t = (X̄1 – X̄2) / (s√(1/n1 + 1/n2))
But don’t freak out over the math! Here’s what it means in simple terms:
– **X̄1 and X̄2** are the averages of your two groups.
– **s** is the standard deviation, which just tells us how spread out our data is.
– **n1 and n2** are the number of observations in each group.
So basically, it tells you how different your group means are relative to all that variability.
Degrees of Freedom
A cool part about using a t-test is calculating something called degrees of freedom (df). You can think about df as an adjustment factor based on sample size. For independent samples, it’s simply (n1 + n2 – 2). The more data points you have, generally speaking, the more reliable your results will be!
P-Value and Significance
When running t-tests, researchers often look at something called p-values to decide if their results are statistically significant. A p-value less than 0.05 usually suggests strong evidence against the null hypothesis (which states there’s no difference between groups). So if your p-value comes back at 0.03 after testing those plants with that fertilizer—boom! You’ve got some significant growth happening there!
A Real-Life Anecdote
A friend once conducted an experiment where she tested whether studying with music helped students perform better on math tests compared to studying in silence. After collecting her data, she was super anxious about running her first t-test but ended up feeling relieved when she saw her results were significant! It felt amazing for her—like she had cracked a mystery that had puzzled many students for ages!
In short, understanding how to use a t-test properly can really elevate your research game. You’ll be able to make decisions based on solid statistical analysis rather than hunches or gut feelings alone—not as good as snacks during study time but pretty close! So next time you’re dealing with data, keep this little gem in mind; it might just save your day or at least give you some impressive insights!
Exploring Real-Life Applications of the T-Distribution in Scientific Research
So, let’s chat about the **T-distribution** and its real-world applications, particularly in scientific research. This statistical tool is as important as your morning coffee if you’re diving into data analysis. Seriously, it can make a huge difference in how researchers interpret their findings.
The **T-distribution** is pretty handy when you’re working with small sample sizes and don’t have a clue about the population standard deviation. It’s like having a secret weapon for those moments when you’re not totally sure what to expect from your data.
- Sample Size Matters: When researchers have small groups—like testing a new medication on just 20 patients—the T-distribution helps them make sense of their results. It’s more forgiving than the normal distribution, which can be misleading if you don’t have enough data points.
- Behavioral Sciences: Imagine a psychologist studying stress levels among students during finals week. They might collect data from just a handful of students and use the T-test to figure out if one group is experiencing significantly more stress than another. This helps them draw conclusions without needing massive samples.
- Medical Research: Think about clinical trials for new drugs. Let’s say researchers test a drug on 15 patients with similar conditions before deciding if it’s effective. Using the sample T-test allows them to see if the changes in health markers (like blood pressure or cholesterol) are statistically significant despite the small number of subjects.
- A/B Testing: Companies love A/B testing to see which marketing strategy works better. If they’re trying two different website designs with only 30 users each, they’ll use the T-test to compare conversion rates between these two sites accurately.
The really cool part? The T-distribution adjusts based on how many samples you have, making it more reliable when you’re dealing with fewer data points. As your sample size grows, guess what? The T-distribution looks more like that familiar **bell curve**, which is comforting, isn’t it?
And what’s wild is that many fields use this everyday without even realizing it! Researchers studying everything from psychology to pharmacology rely on it—kind of like how you don’t always think about how your phone connects to Wi-Fi; you just want it to work!
In summary: The **T-distribution** provides clarity and validity in scientific research whenever you’re swimming in small sample sizes or uncertain about variability. Researchers lean on it every day to ensure they’re making sound decisions based on solid statistical evidence!
Exploring the Applications of the Sample t-Test in Scientific Research: A Comprehensive PDF Guide
Alright, let’s chat about the sample t-test and why it’s kind of a big deal in scientific research. So, you know how sometimes we want to figure out if two groups are really different from each other? Well, that’s where the sample t-test swoops in like a superhero!
The sample t-test is mainly used when you have small sample sizes and you want to compare their means. You remember mean, right? That fancy term for the average value. If you’re testing a new drug against a placebo, for example, you’d want to see if the patients taking the drug had a different average recovery time than those who didn’t. Pretty crucial stuff!
Here are some key applications of the sample t-test:
- Medical Research: Imagine scientists testing whether a new treatment speeds up recovery times. They can use the t-test to compare those on the treatment versus those not on it.
- Psychology Studies: Researchers might investigate if two teaching methods result in different test scores among students. The t-test helps them determine if any difference observed is statistically significant.
- A/B Testing in Marketing: Companies could use it to see if one version of an ad leads to more sales compared to another version.
The heart of this test is pretty straightforward but still requires some care. You start by computing your mean and then looking at how spread out your data is—this is called variability. From there, you calculate something called the t-statistic, which basically tells you whether any differences between groups are just due to random chance or not.
Let’s touch on assumptions too because they’re super important! For the sample t-test to work right:
- The samples need to be independent—you can’t have them influencing each other.
- Your data should be normally distributed; think bell curve here.
- The variances of both groups should be roughly equal—this one’s called homogeneity of variance.
If these assumptions hold true, amazing things can happen! But what if they don’t? Well, researchers might choose alternative tests that don’t require these conditions. It’s all about fitting the right tool for your research question!
If you’ve ever felt overwhelmed by stats, that’s totally normal! Just remember that at its core, the sample t-test provides valuable insights into differences between groups based on sampling data. And once you get used to it—well, you’ll realize it’s less daunting than it seems at first glance.
So there you have it! The sample t-test isn’t just a dry statistical method; it’s an essential part of making sense of human experiences and scientific investigations. From medical trials to educational experiments, it’s there crunching numbers and helping researchers find meaningful answers.
You know, when we talk about the sample t-test, it doesn’t sound all that exciting at first glance. It’s just a fancy name for a statistical method that helps researchers determine whether two groups are different from each other. But let me tell you, this little thing is like a superhero in the world of scientific research!
I remember back in college when I was working on a project about how studying with music affects test scores. Just trying to figure out if there’s really any difference between students who study in silence versus those who jam out to their favorite tunes seemed daunting at first. Then I stumbled upon the t-test! It kind of felt like finding a secret weapon. By using this test, I could analyze my data and see if any differences were statistically significant, rather than just relying on gut feelings or hunches.
In real life, the applications of the sample t-test are endless! Researchers use it everywhere—from medicine to psychology and beyond. For instance, imagine a scientist testing a new medication on one group while giving another group a placebo (that’s just something that looks like medicine but does nothing). They can use the t-test to check if there’s a meaningful difference in health outcomes between those who received the actual drug and those who didn’t.
Or think about social science research where you want to compare the attitudes of two different age groups towards climate change. The t-test can help determine if younger folks really do have different views compared to older generations or if it’s just noise in the data.
But what strikes me most about these applications is that they bring clarity to our questions! It allows researchers to move beyond simple observations and into evidence-based conclusions. If your results show that studying with music really does lead to higher test scores—and you can back it up with numbers—that changes everything, right? You could even influence study habits in schools!
So yeah, while statistics might seem dry or super technical at times, tools like the sample t-test are vital for turning fuzzy ideas into solid knowledge. It reminds us that beneath all those numbers lies real-life implications—like effectively treating illnesses or improving educational practices—which makes it all feel much more meaningful than just math for math’s sake!