Alright, picture this: you’ve just mixed up a batch of cookie dough. Chocolate chips, nuts, maybe a sprinkle of sea salt—yum! But then, you realize you forgot to ask your buddy if they’re allergic to nuts. Uh-oh!
This is kinda like genetics. You know? You can’t just throw traits together without thinking about what might come out on the other side. That’s where Punnett squares come in.
They’re like your recipe for figuring out what traits your kids—or in this case, little plants or animals—might inherit. It’s simple math meets biology in the best way possible!
Curious about how it all works? Stick around as we break it down together and make genetic inheritance a whole lot clearer!
Understanding the Punnett Square: A Key Tool in Genetic Inheritance Analysis
So, let’s chat about the Punnett Square. Ever heard of it? It sounds kinda fancy, but don’t worry, it’s just a neat little tool that helps us understand how traits are passed down from parents to offspring. You know how you might have brown hair and your best friend has blond hair? That’s genetics at work!
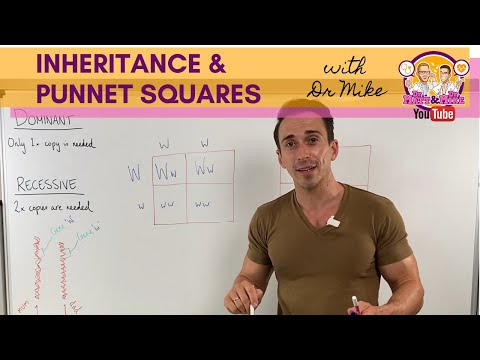
A Punnett Square is like a simple diagram that shows all the possible combinations of alleles (that’s just a fancy word for different forms of a gene) that kids could inherit from their parents. Basically, it’s a way to visualize genetic inheritance patterns.
When you start using a Punnett Square, you first need to know about the alleles involved. Let’s say we have two traits: one for flower color in pea plants—let’s call it purple (dominant) and white (recessive). If one parent plant has the genotype PP (homozygous purple), and the other has pp (homozygous white), you can set up your square like this:
1. Draw a square and split it into four smaller boxes.
2. Write one parent’s alleles on the top and the other’s on the sides.
Now, fill in each little box by combining the alleles from both parents. If you’re following along with our flower example:
– The top would be PP.
– The side would be pp.
That’ll give you:
- PP
- PP
- Pp
- Pp
What this means is that every offspring from these two plants has a chance of being either purple or white flowers! So in this case, all offspring have purple flowers since purple is dominant.
But wait! There are more fun things we can do with this square! You can also look at traits where both parents have different variations. Like if mom is heterozygous (Pp) and dad is homozygous recessive (pp):
1. Again, draw four boxes—same deal.
2. This time at top put Pp and at side put pp.
Then fill it out:
- Pp
- Pp
- pp
- pp
This time round, half of the offspring will have purple flowers while half will have white ones.
It’s not just plants though; think animals too! Use this method to figure out things like whether puppies will have long or short fur based on their parent’s genes.
One last thing—always remember that real life isn’t so cut-and-dry! Environmental factors also play a role in how traits present themselves, which makes genetics even more fascinating. But hey, using a Punnett Square gives you that initial snapshot of what could happen!
So there ya go! That little square can help unlock some big mysteries about inheritance patterns in genetics—it puts all those potential combinations right in front of you so you can see what’s what!
Understanding Punnett Squares: Visualizing Genetic Outcomes in Science
Sure! Let’s talk about Punnett Squares and how they help us understand genetic outcomes. They’re like little charts that help you visualize how traits get passed down from parents to their offspring. You know, it’s all about the cool world of genetics!
What is a Punnett Square?
So, a Punnett Square is basically a grid that shows all the possible combinations of alleles—those are the different versions of a gene—when two organisms breed. You can think of it like a game board where you match up alleles from each parent to see what traits might pop up in the kids.
Here’s how it works: imagine you have one parent with the genotype (that’s just a fancy word for genetic make-up) TT (let’s say this means tall plants) and another with tt (short plants). The tall trait is dominant, which means it overshadows the short one. If you set up your Punnett Square, you’d get something like this:
- T T
- t | Tt | Tt
- t | Tt | Tt
So what does that mean?
You’d end up with four squares showing possibilities for their offspring. In this case, 100% are Tt, which means all offspring will be tall! Pretty neat, huh?
The beauty in simplicity:
You can even use these squares for traits beyond just height! Whether it’s fur color in animals or seed shape in plants, they’re super handy. It becomes clear how certain traits dominate while others remain hidden.
Now, there’s something really cool called dihybrid crosses. That’s when you look at two traits at once—say flower color and plant height. The grid gets bigger because you’re combining more alleles, but the idea remains the same! When both parents have a mix of traits, like RrYy (round yellow seeds) and rryy (wrinkled green seeds), your Punnett Square expands into 16 boxes. That’s where things can get pretty interesting and complex!
Why should we care?
Understanding these squares isn’t just for science geeks; they’re super relevant in breeding programs and even genetic counseling. By knowing how traits might combine in future generations, we can make informed decisions about breeding animals or predicting inherited conditions.
A fun little story:
Once while volunteering at an animal shelter, I met someone who bred dogs for specific traits like temperament and size. When they talked about using charts similar to Punnett Squares to predict puppy looks based on parent breeds? Well, I was amazed! Their system helped them ensure healthier pups with desirable characteristics—just shows you how impactful this science can be!
In short, Punnett Squares are all about visualizing genetic inheritance. They break down complex ideas into simple grids so anyone can see what combinations might emerge when genes mix. Whether you’re an aspiring scientist or just curious about genetics, these tools open up a whole new way to understand life itself!
Understanding Punnett Squares: Visualizing Genetic Inheritance Patterns in Genetics
So, let’s get into the world of **Punnett Squares**. You’ve probably seen those little grids in biology class, right? They’re a nifty way to visualize how traits get passed down from parents to offspring. The whole idea is to help you understand **genetic inheritance patterns** without getting lost in complicated jargon.
Basically, a Punnett Square is like a simple chart. You draw a big square and split it into four smaller squares (or more, if you’re exploring more complex traits). The top usually has one parent’s alleles (that’s just a fancy word for gene variants), and the side lists the other parent’s alleles.
When you combine them, you get the possible genetic combinations for the offspring. It’s sort of like playing a game of chance where you can predict outcomes instead of leaving it all up to luck!
Here’s an example: let’s say we’re looking at flower color in pea plants. If we have one plant with two dominant purple flower alleles (let’s call these “PP”) and another with two recessive white flower alleles (“pp”), you’d set up your Punnett Square like this:
Top Row:
– P
– P
Side Column:
– p
– p
Now, when you fill in the squares, each square represents a possible combination of alleles for the offspring:
- PP
- PP
- Pp
- Pp
In this case, every single plant would have purple flowers since purple is dominant over white. Crazy how something so simple can explain so much about life!
Now, what happens if one parent has heterozygous traits—meaning they have different alleles? Imagine we change our first plant to “Pp.” Now your square looks like this:
Top Row:
– P
– p
Side Column:
– P
– p
When filled out, it would show:
- PP
- Pp
- Pp
- pp
This time around, you’ll have 50% chance for purple flowers (PP or Pp) and 25% chance for white flowers (pp). It’s kind of stunning how predictable these patterns can be!
But here’s where it gets even cooler! Punnett Squares work not only for one trait but can be expanded for multiple traits too—like flower color and height at once. This is called a dihybrid cross. You might draw an even bigger square that combines these traits together.
The thing is, genetics can get pretty complex as you add more traits or delve deeper into concepts like incomplete dominance or co-dominance. But stay chill! The basics are really about seeing how traits might mix in predictable ways.
So there you go! Next time someone mentions a Punnett Square, you’ll know it’s not just some grid; it’s a tool that gives insight into the rules of life itself—the way traits are inherited across generations! Isn’t that something?
You know, when I first heard about Punnett squares, I thought they sounded like something out of a science fiction novel. I mean, what even is a Punnett square? But then I learned about them, and wow—what a neat little tool for understanding genetics!
Let me tell you a quick story. Back in middle school, we did this fun project where we had to predict the traits of little plant babies for a class garden. We worked in pairs and tried to figure out what color the flowers would be based on their parent plants. That’s when my partner introduced me to this grid-like chart called a Punnett square. At first, I was totally lost! But as we filled it out together, it felt like drawing a family tree but for genes. It was eye-opening.
So here’s the scoop: a Punnett square helps you visualize how traits get passed from parents to offspring. Basically, each parent has two alleles for a trait—like one from mom and one from dad—those alleles are like instructions that can say “make red flowers” or “make yellow flowers.” The cool part is that when you combine those alleles in the Punnett square, you can see all the possible combinations that could pop up in the next generation.
Imagine it as if you’re playing genetic bingo! You fill in the squares with different possible combinations based on what each parent brings to the table. The boxes show you probabilities—not guarantees—that certain traits will appear. So it’s more like predicting than just plain facts.
But let me be real with you; it doesn’t always work perfectly because nature is wild and full of surprises! Some traits can be influenced by more than one gene—or even environmental factors—which makes things way more complicated than just filling out some boxes.
What struck me then and even now is how powerful this simple diagram is in helping us understand inheritance patterns. It gives you a glimpse into why you might have your dad’s curly hair or your mom’s bright blue eyes—it’s all written in those little molecular instructions we inherit without even thinking about it.
So next time someone mentions Punnett squares, hopefully you’ll think of those colorful flower predictions instead of some dry science term. It’s all about making those connections between generations—and finding beauty in how life carries on!