You know that feeling when you’re trying to predict the outcome of a game, and you can totally feel the tension? Like, imagine if you could just whip out a calculator and figure it all out based on past scores. Sounds fun, right?
Well, that’s kind of what regression techniques do in the world of science. They help researchers find patterns in data—like a detective piecing together clues to solve a mystery. Ever noticed how trends seem to pop up everywhere?
From predicting weather changes to figuring out if that new coffee blend actually boosts your mood, regression is like this invisible tool that scientists use to make sense of all those numbers swirling around. It’s all about digging into data and understanding what it really means. So grab your favorite drink, and let’s chat about how these techniques really work!
Understanding Regression Techniques in Scientific Research: A Comprehensive Guide
Regression techniques can initially sound a bit intimidating. But honestly, they’re just a way of figuring out relationships between things. You know, like how your coffee consumption might relate to your energy levels—more coffee, more buzz? That’s a basic idea of regression!
What is Regression?
So, regression is basically a statistical method used to understand the connection between variables. For example, researchers might want to know how temperature affects ice cream sales. They collect data on both and use regression to see if there’s a clear link.
Types of Regression Techniques
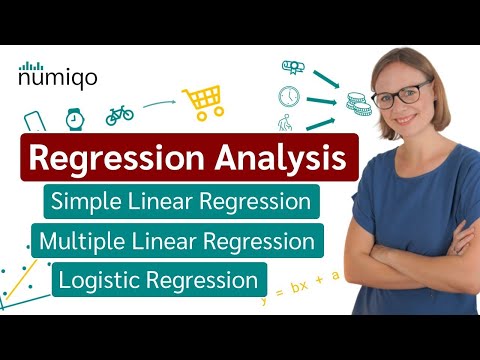
There are several types of regression techniques, and each serves its purpose based on what you’re studying:
- Linear Regression: The simplest form. Picture it as drawing a straight line through your data points on a graph. It’s used when you think there’s a direct relationship.
- Multiple Linear Regression: This one looks at more than one variable at once. Think of it as trying to find out how both caffeine intake and sleep affect your alertness.
- Polynomial Regression: Sometimes relationships aren’t just straight lines; they curve! Polynomial regression helps model those curvy relationships.
- Logistic Regression: When you have yes/no outcomes—like whether someone will buy that extra slice of pizza—logistic regression comes into play!
Each type has its own flair and reasons for being used.
The Process Behind It
So how does this all work in practice? Typically, here’s what happens:
1. **Data Collection:** First off, you need good data! Researchers gather numbers related to their variables.
2. **Choosing the Right Technique:** Depending on the nature of the relationship you expect (a straight line or maybe something curvy), they’ll pick the appropriate regression technique.
3. **Analyzing Data:** Next up? They’ll apply mathematical formulas to create an equation that represents their findings.
4. **Interpreting Results:** Finally, they’ll interpret the results and decide if there’s actually evidence supporting their hypothesis about relationships among variables.
For instance, let’s say after conducting a study with multiple linear regression about exercise habits and stress levels, researchers find that people who exercise regularly report lower stress levels—now that’s interesting!
The Importance in Research
So why bother with all this? Well, understanding these relationships can lead to better decision making, whether it’s in health policies or marketing strategies. Imagine if businesses could predict ice cream sales based on weather forecasts—that’s powerful!
Moreover, using these techniques responsibly helps scientists avoid making misleading conclusions from their data.
In wrapping this up (not that we don’t love chatting about stats!), regression techniques are essential tools in scientific research for uncovering relationships among variables. Whether you’re looking into environmental changes or human behavior patterns, these methods provide insights that can significantly impact our understanding—and who wouldn’t want that?
Mastering Regression Analysis: The 7 Essential Steps for Scientific Research
So, regression analysis, huh? It sounds all fancy and stuff, but really, it’s just a way for scientists to understand relationships between different things—like how much sleep you get affects your test scores. Cool stuff! So let’s break it down into some essential steps that can help you get a handle on it.
Step 1: Define Your Research Question
First off, you gotta know what you’re asking. What do you want to find out? For example, if you’re curious about the relationship between exercise and mood, that’s your starting point. Narrow it down so there’s no confusion later.
Step 2: Collect Your Data
Now comes the fun part—collecting data! You can’t analyze what you don’t have. You might conduct surveys or pull stats from somewhere like a health database. Let’s say you’re gathering info on people’s exercise habits and their reported moods. Just remember: the more quality data you have, the better!
Step 3: Choose the Right Type of Regression
There are different flavors of regression analysis. Simple linear regression looks at one dependent variable and one independent variable (like simple math). But if you’ve got more factors at play—like age, diet, or sleep patterns—you might go for multiple regression instead. Each type has its own use cases!
Step 4: Prepare Your Data
Okay, now you’ve got your data; it’s time to clean it up! This means checking for weird outliers that could mess things up or missing values that can lead to confusion. Imagine trying to evaluate how folks feel after workouts but someone says they ran fifty miles when they really jogged around the block—that’s gonna skew your results!
Step 5: Run Your Analysis
Now it’s showtime! You can use statistical software like R or Python to run your regression analysis. These tools will help you see how different variables interact with each other. If exercise hours predict mood improvement significantly, you’ll spot that connection here.
Step 6: Interpret Your Results
Once you’ve got those numbers back from your analysis, it’s time to read them like a story! Look at coefficients which tell you how much impact one variable has on another. For instance, if exercise increases mood by an average of three points for every hour spent exercising—that’s valuable info right there!
Step 7: Report Your Findings
Finally, share what you’ve learned! Whether it’s writing a paper or giving a presentation, be sure to explain everything clearly so others can understand your findings too. Use graphs or tables because they make complex data easier to digest.
So there you have it—the steps to master regression analysis in scientific research! It may sound tricky at first glance but ,by breaking it down step by step and keeping things simple ,you’ll find yourself on solid ground before long . Good luck with your research adventures!
Exploring the Four Types of Regression: A Comprehensive Guide for Scientific Analysis
Regression is one of those terms that shows up in all sorts of scientific studies, and it’s really just a fancy way of understanding relationships between things. You might’ve heard folks chatting about “types of regression” and thought, “What the heck does that even mean?” Well, let me break it down for you!
1. Linear Regression is like the baseline when it comes to regression techniques. It’s used when you want to predict a value based on a straight-line relationship. Imagine you’re trying to figure out how much your plant grows based on how much sunlight it gets. If you plot the hours of sunlight on one axis and the height of the plant on the other, linear regression helps you draw that line through your data points.
2. Logistic Regression sounds a bit more complicated, but actually, it’s super useful when you’re dealing with yes-or-no outcomes—like figuring out if a student passes or fails based on study hours. Instead of predicting continuous values like height or weight, logistic regression predicts probabilities. So, instead of saying someone will pass with 100% certainty or fail with 0%, it might say there’s an 80% chance they’ll pass.
3. Polynomial Regression? Well, that’s just adding some flair! Instead of sticking with straight lines, polynomial regression allows for curves—perfect for situations where data isn’t linear at all. Think about how car speeds might change over time: initially fast as they accelerate but slowing down eventually as they hit top speed and start braking. Here you’d use polynomial regression to create a curve that fits these shifting dynamics.
4. Ridge and Lasso Regression, now this is where things can get a touch tricky but bear with me! Both are used when you have lots of variables in your model—like trying to predict college success based on tons of factors like grades, extracurriculars, and socioeconomic status. Ridge regression helps by shrinking coefficients (that’s just a fancy word for numbers in your equation) without completely removing them from consideration; while Lasso actually takes some variables out entirely if they’re not useful.
So look at these methods not as isolated techniques but as tools in your toolkit! When using these regressions appropriately can be like having superpowers to unlock insights in your data that would otherwise be impossible to figure out.
And here’s a little tip: always make sure you understand what kind of relationship you have before choosing which type to use—and don’t forget about checking assumptions! Each type has its quirks and best uses based on what you’re trying to analyze or prove in your research.
It’s honestly thrilling how this stuff connects so many different fields—from psychology to economics—and helps us see patterns hidden deep within our numbers! Keep exploring; there’s always something new around the corner!
So, you know when you’re trying to make sense of a jumble of information? Like, when your friend starts rambling about why they think pineapple belongs on pizza—and you’re just nodding along, hoping to find some logic in their chaos? That’s sort of what regression techniques do in scientific research. They help researchers pull out the important bits from all that noise.
Think about it this way: regression techniques are like those wise old friends who remind you what truly matters. They help scientists figure out relationships between different variables. Let’s say you’re curious about how temperature affects ice cream sales on a hot summer day. Regression analysis helps determine if there’s really a trend there or if it’s just wishful thinking and really good marketing. You might find that for every degree the temperature rises, ice cream sales go up by a certain percentage. Pretty neat, huh?
I remember a time when I was working on a school project analyzing how study hours impacted test scores. It was all over the place—some students studied for hours and still bombed their exams while others nailed it after just a quick review session. Using regression made everything clearer. Suddenly, I could pinpoint patterns that were hidden in the chaos and realize that quality of study time mattered more than quantity.
But here’s the kicker: regression isn’t without its quirks. You can end up with deceptive results if you don’t tweak things right or if you overlook some important factors—that’s known as “overfitting.” It’s like buying an expensive pizza maker because your friend swears that it’ll change your culinary life, only to find out it doesn’t fit into your kitchen without knocking over every spice jar.
And then there’s the idea of correlation versus causation—you know, that classic mix-up? Just because two things seem linked doesn’t mean one causes the other! Like just because people who eat more ice cream tend to drown doesn’t mean eating ice cream makes you sink… although I wouldn’t recommend testing that theory!
When researchers harness these techniques thoughtfully, they can unveil profound insights in various fields—from public health to economics and environmental science—showcasing how interconnected everything really is. The world is complex; understanding these connections is crucial for making informed decisions or policies.
So yeah, as messy as data might seem at first glance, regression techniques offer us tools to cut through the confusion. They remind us to look closer at those patterns instead of just accepting things at face value—and honestly? That kind of clarity can be pretty empowering in scientific research!