So, picture this: you’re at a party, and someone starts rambling about statistics. You can practically hear the crickets chirping! But hold up—what if I told you that regression analytics could spice things up? Seriously!
Okay, maybe not party-spicy, but it’s a real game changer in science. Imagine trying to predict the weather, figure out how much coffee you need to stay awake, or understand why your plants keep dying. That’s where regression comes in.
Regression analytics is like your trusty sidekick for making sense of data. It helps scientists figure out the “why” behind trends and relationships.
And hey, if you think numbers are boring, just wait until you see how they can explain everything from health trends to climate change in a way that actually makes sense! Ready for the ride?
Exploring the Four Types of Regression Analysis in Scientific Research
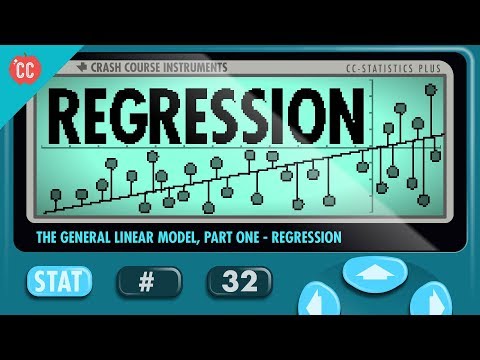
Regression analysis is like having a trusty flashlight that helps you see the patterns hidden in your data. You might think, “What’s so special about that?” Well, when scientists want to understand relationships between variables—like how temperature affects plant growth—regression analysis steps in to reveal insights. There are four main types of regression commonly used in research: linear, logistic, polynomial, and multiple regression. Let’s break these down a bit.
1. Linear Regression: This one is probably the most straightforward. Imagine you have a graph where you plot your data points—like how much sunlight each plant got and how tall they grew. Linear regression tries to draw a straight line that best fits those points. It shows you the general trend of your data. If there’s a positive slope, it means more sunlight generally leads to taller plants. Simple enough, right?
2. Logistic Regression: Now, this type is for when you have categorical outcomes. Think of a scenario where you’re predicting whether students pass or fail an exam based on their study hours and sleep quality. You can’t use linear regression here since you’re not looking for a straight line but rather the probability of an outcome falling into one category or another—pass or fail. Logistic regression helps model this kind of data by using an S-shaped curve (or sigmoid function) that predicts probabilities between 0 and 1.
3. Polynomial Regression: Sometimes, things get a bit curvy! Linear regression works well when there’s a straight relationship between variables, but what if there are twists? For example, suppose you’re studying how fertilizer affects crop yield at different levels; it might be that too much fertilizer leads to lower yields after reaching an optimal amount. Polynomial regression allows for curves in the data by using squared terms (like x²) to capture those non-linear relationships.
4. Multiple Regression: Instead of just looking at one variable affecting another—like just sunlight on plant growth—what if you want to include several factors at once? Multiple regression does just that! You could analyze how sunlight, water amount, soil type, and temperature all work together to affect plant height simultaneously.This is super useful because real-world scenarios are rarely simple; there are often many variables at play.
So there you have it! These four types of regression help scientists make sense of complex data and uncover relationships that can lead to meaningful conclusions. It’s all about finding the right tool for the job—and every type has its strengths depending on what you’re trying to figure out! Whenever researchers embark on their journeys through numbers and patterns, they’re actually navigating through what we call regression analytics. It’s pretty cool stuff!
Mastering Regression Analysis: The 7 Essential Steps for Scientific Research
Well, regression analysis sounds all fancy and stuff, but at its core, it’s really about figuring out relationships between things. Like when you want to know how study hours affect your test scores, right? So let’s break down how you can master this concept in a way that makes sense.
Step 1: Understand Your Question
First off, what do you want to find out? Maybe you’re curious about how food intake impacts energy levels. Clarity in your question can save you tons of headache later. It’s like knowing what you’re looking for before you go on a treasure hunt.
Step 2: Collect Your Data
Next up is gathering data. This is where real science gets gritty! You could collect data from surveys, experiments, or existing databases. Just ensure your data is reliable—if your sources aren’t solid, it’s like building a house on sand.
Step 3: Explore the Data
So now you’ve got your data; what’s next? You need to explore it! Look at the basic statistics and visualize it with graphs or charts. It’ll give you insight into any patterns or weirdness (like outliers) lurking in the data.
Step 4: Choose the Right Model
This part’s interesting because there are multiple regression models—linear regression being the most common. If you’re measuring a straight-line relationship, linear makes sense. But if things are more complex, maybe you need polynomial regression or logistic regression. It’s sort of like choosing the right tool for a job!
Step 5: Fit the Model
Once you’ve decided on a model, it’s time to fit it to your data. Basically, this means finding the best line (or curve) that represents your data points. You’ll use software tools for this because doing it by hand is… well, let’s just say not practical!
Step 6: Validate Your Model
Okay, now you’ve got a model—but does it actually work? You’ll need to check its accuracy using something called validation metrics (like R-squared). Imagine it as checking your math homework before turning it in—just to be sure it’s right!
Step 7: Interpret and Share Findings
Finally comes interpretation! What does your model tell you? And how can others benefit from this info? Share findings clearly so others understand—you don’t want all that hard work to go unnoticed! An example could be publishing your results in scientific journals or presenting them at conferences.
So there you have it! Mastering regression analysis involves understanding questions clearly and going through systematic steps—from collecting reliable data all the way to interpreting results that matter. Each step builds on the last; take shortcuts, and you might end up lost! Remember: it’s all about making sense of numbers and relationships—they’re telling stories waiting for an audience!
Exploring the Capabilities of ChatGPT: Can AI Assist in Scientific Regression Analysis?
So, let’s talk about regression analysis, a super important tool in science. Basically, it helps researchers understand relationships between different variables. You know how if you water a plant more, it usually grows better? That’s kind of what regression does—it looks at data to find those connections.
Now, ChatGPT and similar AI tools can really step in here to make things easier. Think about all the time researchers spend crunching numbers and figuring out complex equations. AI can help speed up that process! Here are some cool ways it can assist:
- Data Handling: ChatGPT can help organize and clean data before running analyses. Sometimes the data we have is messy—like a spilled bag of marbles! The right setup is essential for good results.
- Model Selection: There are different types of regression models—linear, logistic, polynomial… You name it! An AI can suggest which one might be best based on the data characteristics.
- Interpretation of Results: After running an analysis, you often have tons of numbers—coefficients, p-values… It’s like trying to read a foreign language! AI can help break those down into simpler terms for better understanding.
- Error Checking: Mistakes happen. A simple typo or wrong input can skew results big time! AI can spot inconsistencies or errors in the data that we might miss.
But let me tell you a little story here. A friend of mine was working on her thesis about climate change effects on local agriculture. She collected loads of data and tried her best with regression analysis but got tangled up in all the stats jargon. Enter ChatGPT! With some trusty guidance from the AI, she figured out how to present her findings clearly and effectively—turning all that complexity into something digestible for everyone.
Of course, it’s not all sunshine and rainbows. Relying too much on AI without understanding the fundamentals could be risky. If someone just takes whatever numbers they get without thinking critically about them—that could create problems down the line.
However, being able to work alongside tools like ChatGPT means researchers have a powerful partner to navigate through scientific questions and big datasets more smoothly than ever before.
So yeah, while AI isn’t going to take over just yet—it’s definitely making strides in helping with scientific regression analysis! And honestly? That’s pretty nifty if you ask me.
Regression analytics, huh? It sounds super technical at first glance, but, honestly, it’s one of those cool tools that can really shine a light on patterns and relationships in data. Imagine you’re at a party, and you notice some people are gravitating towards the snacks while others are chatting away. You might start wondering: Does more conversation happen when the snack table is full? Regression analytics is like that—it helps scientists figure out how different factors influence something.
Let me tell you a little story. A while back, I was at this small science fair where local researchers showcased their work. One project had to do with how different kinds of soil affected plant growth. They used regression analysis to show that certain soil types really made plants grow taller than others. It was like unveiling a secret ingredient! The students were buzzing; they got to see firsthand how numbers and stats can explain real-world situations.
Now, in scientific research, regression isn’t just about crunching numbers to win a science fair; it’s essential for making sense of complex data sets. For instance, if researchers want to determine if a new drug affects blood pressure, they can use regression models to analyze patient data and control for variables like age or existing health issues. By doing this, they get clearer insights about what’s actually happening.
And here’s where outreach comes into play. When scientists or advocates present findings from these analyses to the public, they’re not just tossing around scientific jargon. They’re telling stories backed by data! You know how much people connect with stories—everyone loves a good tale! So when researchers explain their results using relatable examples or visuals derived from regression analysis, it becomes so much more engaging.
But there’s another side to this coin: communication challenges exist too. Sometimes the numbers can feel overwhelming or misleading if not presented well. That’s why it’s crucial for scientists involved in outreach to break things down clearly without losing sight of the essence of what they’re trying to convey.
So yeah, regression analytics plays a big role in helping us understand our world better—both in research labs and at community gatherings. It’s all about using those statistics wisely so we can inspire and inform folks about the wonders (and complexities) of science!