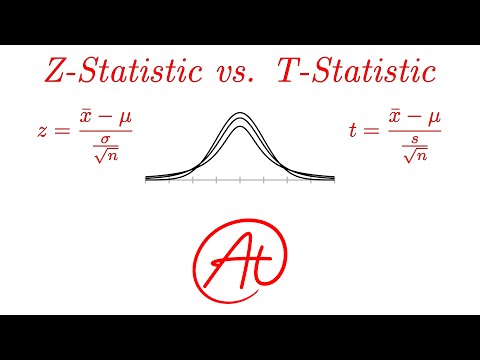
So, picture this: you’re sitting in a room full of scientists, all serious and stuff, and someone drops a T Distribution Table on the table. Everyone suddenly gets super excited. Like, what’s the deal with that?
You might think it’s just another boring chart, but oh man, it’s like the secret sauce for making sense of your data! It helps you figure out if your results are legit or just a fluke.
But here’s the kicker—most folks don’t even know how to use it! It can feel pretty intimidating, right? Trust me, though; once you get the hang of it, you’ll feel like a data wizard! Let’s dive into this whole T distribution thing together. You’re gonna want to stick around for this!
Understanding the Application of t-Distribution in Scientific Research: Key Reasons for Researchers
The t-distribution might sound a bit technical, but it’s pretty crucial in research, especially when dealing with small sample sizes. So let’s break it down into bite-sized pieces.
To start with, the t-distribution is like a cousin of the normal distribution, but it’s wider and has fatter tails. This means that it accounts for extra variability when you’re working with smaller groups. Picture yourself trying to figure out how much people like pizza at a small gathering versus a massive party. With just a few opinions, you might get wildly different results compared to getting feedback from a hundred folks.
Why do researchers lean on the t-distribution? Here are some reasons:
- Small Sample Sizes: When your sample size is less than 30, using the t-distribution helps prevent underestimating uncertainty.
- Estimating Population Parameters: It aids in understanding population averages when you can’t collect data from everyone.
- Hypothesis Testing: Researchers often use it to test if their findings are significant or just due to random chance.
- Confidence Intervals: It helps in calculating ranges where the true average may lie, making sure your guesses are grounded.
Let’s say you conducted an experiment on how different fertilizers affect plant growth. You can only test five plants with each fertilizer type because of space limits. Here’s where the t-distribution comes to your rescue! Instead of assuming your results fit perfectly into a neat bell curve like the normal distribution, you use this wider distribution to account for unpredictability.
Another key thing is that as your sample size grows bigger—over 30—the t-distribution starts looking more like the normal distribution. This is cool because it means if you’re working with larger sets of data, you can feel more confident about using simpler techniques.
But wait! There’s another piece to this puzzle: The t-Distribution Table. It’s essential for actually crunching those numbers and figuring out what they mean in context. When you look up values in this table, it gives you critical values that help in determining confidence intervals and testing hypotheses.
So next time you’re reading about scientific papers or diving into research yourself, remember how those researchers are weaving numbers together using tools like the t-distribution. It’s one of those unsung heroes behind making sense of what sometimes feels like overwhelming data!
Understanding the T Table in Research Methodology: A Key Tool for Scientific Analysis
So, let’s talk about the T Table. You might have heard of it before, especially if you’ve had any experience with statistics or research. Basically, it’s a tool that helps us figure out how likely something is to happen—or, more scientifically put, it helps us determine the significance of our results.
When researchers conduct experiments or analyze data, they often want to know if their findings are just due to chance or if there’s a real effect happening. Enter the T Table. It’s part of the T distribution, which is a type of probability distribution that describes how data behaves when we’re dealing with small sample sizes.
Imagine you’re conducting an experiment on plant growth with just a handful of plants. If you see that one group grows taller than another, how can you say for sure that the difference is significant? That’s where the T Table comes in handy!
- Degrees of Freedom: This is basically related to your sample size. The fewer samples you have, the more uncertainty there is in your estimate. You get degrees of freedom by taking your sample size and subtracting one from it.
- T Score: This score tells you how far away your sample mean is from the population mean (the average). It’s calculated using your data and helps determine significance.
- P Value: This value tells us about the probability of observing our results if there were no real effect. A lower p-value usually means our results are statistically significant!
The T Table itself lists various T scores associated with different degrees of freedom and desired levels of significance (like 0.05 or 0.01). When you look up your calculated T score in this table, you’ll find out if it’s above or below what you’d expect by chance alone.
For instance, let’s say you’ve got a T score from your analysis that turns out to be 2.5 with a degrees of freedom count at 10. You’d look for that value in the table under your significance level—if it falls into the critical region, hooray! Your results are significant!
This whole process might sound complex at first — and sure, it has its quirks – but once you wrap your head around it, using a T Table becomes second nature for analyzing scientific data.
A little anecdote: I remember back in my stats class freaking out over whether my results meant anything at all! But once I understood how to use the T Table during my final project on plant growth (ironically enough), everything clicked into place! That “lightbulb moment” made all those numbers feel like they actually mattered.
So anyway, understanding how to utilize a T Table effectively lets scientists draw more reliable conclusions and contributes meaningfully to research findings. It’s kind of like having a cheat sheet for figuring out what those pesky numbers are really saying!
Exploring Real-Life Applications of the T-Distribution in Scientific Research and Data Analysis
So, the T-distribution, huh? It’s this mathematical gem that pops up a lot in scientific research and data analysis. Basically, it’s super handy when you’re working with smaller sample sizes or when you don’t know the population standard deviation. If you’ve ever dabbled in statistics, you’ll know the regular normal distribution isn’t always your best friend.
Let’s break this down a bit.
What is the T-Distribution?
The T-distribution looks pretty similar to the normal distribution, but it has heavier tails. What this means is that it accounts for more variability and uncertainty when you’re working with smaller datasets. The degree of “heaviness” in those tails depends on something called degrees of freedom (which usually relates to your sample size).
Why Use It?
You might be scratching your head wondering why not just stick with normal distribution all the time. Well, let’s say you’re in a lab testing a new drug on just 15 people. You won’t have enough data to confidently say how that drug will behave in larger populations, right? So instead of risking it with the normal distribution, you switch to T-distribution for better accuracy.
And here are some key points about using the T-distribution:
- Small Sample Sizes: When your sample size is less than 30, using the T-distribution helps prevent underestimating variability.
- Estimating Population Mean: If you’re estimating a population mean from sample data and need some wiggle room for error—T-distribution is your go-to.
- Hypothesis Testing: Often used in t-tests which help you determine if there’s a significant difference between groups or conditions.
Now think about scientific fields like psychology or biology where researchers often deal with small participant pools due to costs or logistical issues. Say you’re testing how effective a new teaching method is on student performance by only sampling 20 students. Using T-distribution allows you to make logical conclusions without feeling like you’re shooting blind.
Anecdote Time!
I remember sitting through stats class back in college. There was this one time where we had a project involving survey data from our fellow students about their study habits and exam performances. We had only gathered responses from around 25 people because let’s face it—who wants to fill out surveys? Anyway, we had initially thought we could use normal distribution methods without checking first. But then our professor reminded us about using the T-table instead! That little lightbulb moment made everything click; we were able to analyze our data correctly and actually draw meaningful conclusions.
So yeah, whether it’s healthcare studies trying out new treatments or educational programs assessing their impact on learning outcomes, applying the T-distribution can make all the difference between solid findings and guesswork.
In summary, if you’re doing any kind of scientific research or data analysis involving smaller datasets—don’t forget about that trusty T-distribution! It may feel a bit more complicated at first glance but trust me; it’s worth understanding for clearer insights into your research!
Using the T distribution table in scientific research is like having that trusty toolbox in your back pocket when you need it. You know, that go-to thing that helps you navigate all those uncertainties? Imagine you’re trying to figure out if a new drug actually works. You gather data from a small group of patients, and now you’re itching to understand what it all means.
Well, the T distribution comes to your rescue! It’s especially handy when you’ve got smaller sample sizes. When I first learned about this, I thought it seemed super complicated, but the reality is pretty straightforward. Basically, the T distribution helps you estimate how much variability to expect when you’re working with limited data—like a safety net for your conclusions.
Now, picture a time when one of my pals was doing their thesis on plant growth and had only a handful of samples from different conditions. They were fretting over whether their findings were statistically significant or just random noise. That’s where the T table stepped in! By using it properly, they could determine if the differences they observed were legit or just due to chance.
The beauty lies in how this tool adjusts for those smaller sample sizes by broadening the possible outcomes and giving you more room for error—because let’s be real; research is often messy. It’s not just about crunching numbers; it’s about understanding what they really mean in context.
You can imagine flipping through the T table as part of this journey—looking up values based on degrees of freedom (which sounds fancier than it is—just a measure reflecting your sample size), and finding critical values that help decide if those tiny differences really matter in real life.
So next time you’re knee-deep in data and feeling overwhelmed, remember: this table isn’t just helpful; it’s also like having an experienced friend guiding you through the foggy paths of statistical significance. It reminds us that even with limited information, we can still reach solid conclusions that help shape our understanding of things—a comforting thought when tackling scientific research!