Alright, so picture this: you’re in a group study session, right? Everyone’s there, coffee cups strewn about, and someone suddenly drops the phrase “t-test” like it’s a secret password to get into some exclusive club.
You’re looking around like, “Um, what?” But then it hits you—this whole t-table thing is a vital part of scientific research.
Honestly, it’s not as intimidating as it sounds. Think of it as your trusty map when you’re lost in the woods of data. You just need to figure out how to read it without getting too lost in the details.
So let’s break down this mysterious t-table together!
Mastering the Student T-Test: A Comprehensive Guide to Interpreting Results in Scientific Research
The Student T-Test often comes into play when you’re trying to figure out if two groups are different from each other. You know, like comparing test scores of students from two different classes. It’s a handy tool in scientific research, especially when sample sizes are small something that’s super common in many studies.
When you run a t-test, you’re basically looking at the means of two groups and checking if the difference between them is significant. Here’s the thing: significance means that the difference isn’t just due to random chance. To check for this, you calculate a t-statistic and then compare it with critical values from the Student T Table.
Now, let’s break down the steps for mastering this test:
- Gather your data: You’ll need measurements or observations from both groups. For example, imagine you’re studying how two teaching methods affect student performance.
- Calculate the means: Figure out the average score for each group. If Class A averages 75 and Class B averages 85, that’s a start.
- Determine the variance: Variance helps us understand how spread out the scores are within each group. If one class has scores all over the place while another is tightly grouped, that’s crucial information!
- Compute your t-statistic: This involves some math—don’t worry; there are calculators and software for it! The basic formula is (mean1 – mean2) divided by standard error.
- Find degrees of freedom: This equals (n1 + n2 – 2), where n is your sample size for each group. Let’s say both classes have 20 students: that would give you 36 degrees of freedom.
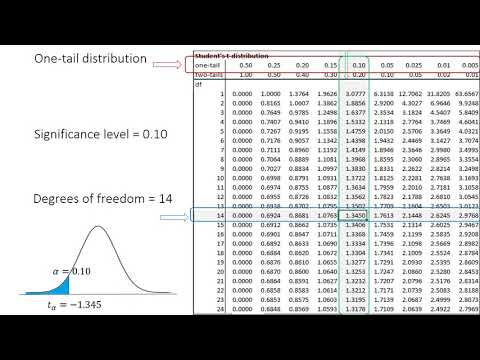
- Look up the critical value: Using your degrees of freedom, head to that Student T Table to find out what value determines significance based on your chosen alpha level (commonly 0.05).
If your calculated t-statistic is greater than this critical value, congratulations! You’ve found a significant difference between those groups.
Let’s not forget about interpreting results in context! Think about what it means if Class A did significantly worse than Class B or vice versa. You should also consider what factors might’ve influenced those results—like differences in teaching styles or student motivation.
Another important point is making sure you know which type of t-test to use—it could be an independent t-test (like our example with two classes) or a paired t-test (if you’re measuring something before and after an intervention on the same subjects).
And then there’s assumptions that come with using a t-test: data should be normally distributed within groups, observations need to be independent…and so on! Always good to keep these in mind.
So next time you tackle a research project involving comparisons between groups, remember this lightweight approach to mastering the Student T-Test! It can feel overwhelming at first glance but take it step by step and soon you’ll be swiping through those tables like a pro!
Understanding the Student’s t-Distribution: Insights and Applications in Scientific Research
So, let’s chat about the Student’s t-distribution. It’s a big deal in statistics, especially when we’re diving into scientific research. You might find yourself scratching your head over some of the concepts, but trust me, it’ll make sense once we break it down a bit.
The Student’s t-distribution is like the cooler cousin of the normal distribution. It comes into play when you’re working with small sample sizes or when you don’t know the population’s standard deviation. Basically, if you’ve got fewer than about 30 data points and you’re trying to estimate means—boom—you’re looking at using the t-distribution.
So why do we care? Well, it helps us understand how our sample means are spread out around the true population mean. Picture this: you’re doing an experiment on plant growth and you only have ten plants to test some fancy new fertilizer. The world isn’t perfect, and because of that variability in your results, you can’t just rely on simple averages. That’s where the t-distribution becomes your best buddy!
Now let’s talk about how to use it in real life. Say you gathered your data and calculated a mean height for those plants. You need to determine how confident you are that this mean reflects the true average height of all plants if they were treated with that fertilizer.
Here’s where the t-table comes in handy. It provides critical values for different confidence levels based on degrees of freedom (which depends on sample size). The more data points you’ve got, the closer your t-distribution gets to a normal distribution, which makes things easier!
- Degrees of Freedom (df): This is typically your sample size minus one (n – 1). So if you’ve got ten plants, df would be 9.
- T-value: This is something you’ll pull from the t-table based on your desired confidence level—say 95%—and your df.
- Confidence Interval: You can calculate this by taking your mean and adding/subtracting (T-value * standard error). This gives you a range where you think the true population mean lies.
And here’s something cool—because of its shape, the t-distribution has heavier tails than a normal distribution. That’s important because it means there’s more area under those tails, which allows for more variability in smaller samples! It acknowledges uncertainty better when we have less data to work with.
Let’s tie this back to an anecdote: I remember helping my friend with her thesis about caffeine effects on study habits. She had only about 12 students taking part in her study—and guess what? We had to use that lovely t-distribution since we were dealing with such a small group! Without it, her results would’ve been way off base regarding what she was trying to prove.
In scientific research, understanding and properly applying the Student’s t-distribution allows researchers to make informed conclusions even with limited data. And really? Isn’t that what science is all about? Taking what little we have and making sense of it? So next time you’re knee-deep in stats for an experiment or project, remember there’s no need to fear those heavy tails!
Mastering the t-Test: Essential Guidelines for Effective Research in Science
So, you’ve heard about the t-Test, right? It’s like that cool friend who always shows up when you need to compare two groups of data. Whether you’re looking at test scores from different classes or measuring the effectiveness of a new drug, the t-Test has your back.
First off, let’s break down what this test actually does. In simple terms, it checks if there’s a significant difference between the means (that’s just a fancy word for averages) of two groups. Pretty handy! But here’s where it gets interesting: it works best when your data is normally distributed. That means if you were to make a graph of your data, it would look like a bell curve. Not all datasets follow this pattern, so keep that in mind!
Now, when we talk about navigating the Student T Table, things might seem confusing at first glance. Don’t sweat it! This table helps you determine whether your findings are statistically significant or just due to random chance. Basically, it tells you the critical values based on your desired level of confidence (commonly 95% or 99%) and degrees of freedom (which is usually calculated based on the sample size).
A good way to think about degrees of freedom is like this: imagine you’re throwing a party with friends. The more friends you have (or data points), the more choices they get to hang out with each other—which gives you more ‘freedom’ to mix and match!
Here are some key points to keep in mind:
- Types of t-Tests: There are several types—like independent samples t-test and paired samples t-test—depending on how your data is structured.
- Assumptions: Make sure your data meets the assumptions for using a t-Test; otherwise, your results might be off!
- P-Values: A low p-value (usually below 0.05) indicates strong evidence against the null hypothesis (which pretty much says there’s no effect).
When conducting your analysis, don’t forget about sample size! A small sample may lead to unreliable results. Think about trying to guess how many candies are in a jar by only counting like five candies—way too risky!
Let’s sprinkle in an example here: say you’re testing whether students who sleep eight hours score differently on math tests than those who only sleep five hours. You collect scores from both groups and run your t-Test. If you find that your p-value is below 0.05 after checking with that trusty Student T Table, congratulations! You’ve got enough evidence to suggest that sleep really does impact test performance.
But remember—just because results are statistically significant doesn’t mean they’re practically important! It’s crucial to consider real-world implications along with those numbers.
In research and science overall, mastering tools like the t-Test can elevate your findings significantly. It’s not just about crunching numbers; it’s about understanding what those numbers mean when telling stories backed by evidence.
So next time you’re faced with comparing two sets of data in research, you’ll feel more ready to tackle it head-on with confidence!
You know, when I first stumbled upon the Student T Table during my research days, it almost felt like learning a secret handshake. Everyone around me seemed to know how to use it, but I was standing there, scratching my head and thinking, “What the heck is this?” I mean, statistics can be intimidating. It’s like trying to understand a foreign language when you’re already battling a million other concepts in your science courses.
So, picture this: you’re working late on a project that you’ve put so much time into. You collect all your data and then… bam! You hit that wall called statistical analysis. This is where the Student T Table comes in—like that friend who always shows up with snacks during study sessions. You might not realize it at first, but this table actually helps you figure out if your data is statistically significant or just random noise.
Here’s the deal. The Student T Test is often used when you’re dealing with small sample sizes and you’re trying to compare means between two groups. Let’s say you want to see if students who study with music score higher than those who don’t. With a small group of friends as your sample (maybe four buddies), running calculations without some help would be tough; that’s where the T Table comes in handy.
Now, navigating it isn’t rocket science, but it does take some practice. First off, you need to know about degrees of freedom—sounds complicated? Hang tight! It’s really just a way of saying how many values in your calculation can vary freely without breaking things down too much. In our music example, if you had four friends studying together and got their test scores, the degrees of freedom would be three (that’s n-1).
After figuring out that number, you look up your T value in the table based on that degree of freedom and your chosen significance level—commonly 0.05 or 0.01 for those high stakes moments in science where we want to be pretty sure about our results.
Seriously though, once you get into it and find what you’re looking for in the table—a specific number indicating statistical significance—you really start feeling like a researcher! It becomes sort of exhilarating; all those hours of studying felt worth it.
But hey, don’t get too caught up in numbers alone! Remember: behind every calculation is real life—your friends nervously tapping pencils as they study or even that kid who always dances around while listening to music before tests!
Navigating through all this data can be tricky at times—it makes some people want to throw their textbooks out the window! But connecting back to the bigger picture is key: what are we really trying to find out here? That mix of curiosity paired with some solid statistical foundation (like using the Student T Table) opens doors for more questions down the line.
So yeah, while numbers might seem cold at first glance, they’re basically stories waiting to unfold if you’re willing to take time understanding them. And that’s pretty exciting!