You know that feeling when you get into a heated debate about which pizza place is the best? Everyone has their favorites, and no one wants to budge. Now, imagine if you had a magic wand that could help settle the argument—kind of like a T test in stats.
So, what’s a T test, you ask? Well, it’s not some secret code or a password for an exclusive club. It’s actually a pretty handy tool that researchers use to figure out if two groups are different from each other in some meaningful way.
Ever been to a party where someone brings two desserts and everyone can’t decide which one is better? Yup, the T test is like your best friend who just takes a bite of each and tells you which one’s truly worth it!
Seriously though, these tests help us make sense of all sorts of data—from examining whether new drugs really work to figuring out if students learn better with certain teaching methods. So let’s break it down and see why T tests are the unsung heroes of scientific research!
Understanding the Role of T-Tests in Scientific Data Analysis: Applications and Implications
So, let’s chat about T-tests. If you’ve ever peeked into the world of scientific data analysis, you’ve probably stumbled upon this tool. Basically, a T-test helps us figure out if there’s a significant difference between the means of two groups. You know, if one group is doing something differently or better than another group?
Think of it this way: Imagine you’re comparing the test scores of students from two different schools. The big question is whether the difference in scores is just random chance or if one school really is performing better. That’s where a T-test steps in to help us out.
Types of T-Tests are pretty straightforward. There are three main types:
Applying these tests isn’t just number crunching; it can lead to stunning discoveries in various fields. For instance, researchers might use independent samples T-tests to check if new medications are more effective than existing ones or even placebo treatments.
Now let’s get into how it works. When you run a T-test, you’re calculating a value called the t-statistic. This value then tells you how far apart your group means are relative to their variability. If the t-statistic is really big (or really small), it suggests that there’s likely something going on—that the differences aren’t just due to random chance.
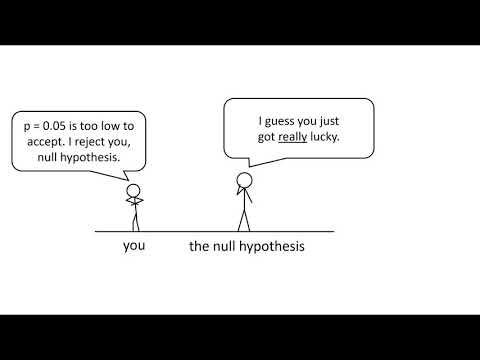
But here’s where it gets interesting: you also have to decide on what’s known as an alpha level (often set at 0.05). This level acts like a safety net for your findings; it tells you that there’s only a 5% chance you’d find these results just by coincidence.
The implications? Well, they’re huge! A well-conducted T-test can confirm something important or challenge accepted beliefs—like when scientists discover that particular teaching methods truly improve student performance more effectively than others.
It’s also crucial to remember that while T-tests can be powerful tools, they do come with limitations. They assume that your data follows a normal distribution and that variances within groups are equal (or pretty similar). If these assumptions are violated? Your results could be skewed.
So yeah, in summary—T-tests help scientists make sense of their data and draw meaningful conclusions about differences between groups. And who knows? Maybe they’ll lead to breakthroughs that change lives! Just think about that next time you hear about research findings that pique your interest!
The Role of T-Tests in Statistical Analysis: Understanding Their Purpose in Scientific Research
So, let’s talk about T-tests, shall we? I mean, they might sound a bit intimidating at first, but seriously, they’re just a fancy way of comparing groups of data. If you’ve ever wondered how scientists figure out if one thing is different from another—like, say, the effectiveness of two different medications—T-tests are usually in the mix.
What exactly is a T-test? Well, it’s a statistical test that helps you determine whether there’s a significant difference between the means (averages) of two groups. Imagine you want to find out if kids who eat breakfast perform better in school compared to those who skip it. A T-test can help you figure out if any difference you observe is real or just due to random chance.
Types of T-tests: There are a few variations that can suit different scenarios:
- Independent Samples T-test: Used when comparing two different groups. Like our breakfast example, you’d be looking at one group of kids who ate breakfast and another who didn’t.
- Paired Samples T-test: This is for when you have related groups. Think before and after results from the same group—like measuring students’ grades before and after implementing a new teaching method.
- One-sample T-test: Here you’re testing the mean of one group against a known value. For instance, checking if the average height of students in your class differs from the national average.
Now, why use them? It all comes down to understanding variability. When you’re working with data—the numbers and measurements—you’re not always going to be 100% certain about what they tell you. A T-test provides a way to quantify how confident you can be that your findings are meaningful.
Also, assumptions matter. For instance, when doing a T-test, scientists often assume that data follows a normal distribution (fancy talk for bell-shaped curves). But hey! Life isn’t always perfect. If your data doesn’t meet that assumption, it could skew results.
Speaking of results—once you’ve performed your test using statistical software or tools (don’t worry; it’s easier than it sounds), you’ll get what’s called a p-value. This little number tells you how likely your results are due to chance. Generally:
- If p is less than 0.05 (that’s 5%), then there’s good evidence to say there is indeed a difference between your groups.
- If p is greater than 0.05? Well, maybe hold off on declaring victory and look deeper into your data.
Here’s where things get real: I remember sitting in my statistics class nervously sweating over my first project involving T-tests. The tension was palpable as we awaited results on whether our hypothesis about study habits affecting grades held any weight. When we finally got positive findings—it truly felt like unlocking a treasure chest! That thrill comes with knowing you’ve used these tests effectively.
In summary: T-tests help make sense of our world by giving us tools to compare groups statistically and determine significant differences in research findings. Whether investigating health impacts or social phenomena, understanding their role puts us one step closer toward uncovering truths hidden beneath layers of data noise.
So next time someone starts talking about statistics at dinner—or maybe even during game night—you’ll know exactly what they’re on about!
Understanding the Importance of the T-Test in Scientific Research: A Comprehensive Overview
The t-test is like that trusty toolbox in your garage that you reach for when you need to know if two groups are different from each other. Basically, it’s a statistical method used to compare the means of two groups. When researchers want to figure out if their findings are significant, they often lean on this test. So, let’s unravel the importance of the t-test in scientific research.
First off, what is a t-test? A t-test analyzes whether there’s a statistically significant difference between the means of two groups. Imagine you have one group of plants watered with regular tap water and another with mineral water. You want to see if one grows taller than the other; that’s where the t-test comes into play.
Why do we need it? Well, not every difference we see is meaningful—sometimes it’s just randomness at play. The t-test helps us determine if our observations are due to chance or indicate a real effect. Think of it like trying to differentiate between a good day and an average one based on temperature changes.
When performing a t-test, you typically consider three key things:
- The Hypothesis: You start with two hypotheses: the null hypothesis (no difference) and the alternative hypothesis (some difference exists).
- The Data: The test requires interval or ratio data collected from both groups, making sure they’re independent.
- The Result: After crunching numbers, you get a p-value that helps you decide whether to reject or accept your null hypothesis.
P-values, by the way, aren’t as scary as they sound! They tell you how likely it is that your results happened by chance. A common threshold used is 0.05—basically saying there’s only a 5% chance that your observed results are just flukes.
You know what’s really cool? There are different types of t-tests! For instance:
- Independent samples t-test: This one compares two separate groups, like our plant example.
- Paired samples t-test: Used when comparing measurements taken from the same group at two different times—like measuring student test scores before and after tutoring.
- One-sample t-test: This checks if the mean of one group differs from a known value—like figuring out if your class average is above 75%.
Anecdote time! I once had a friend who swore their homemade pizza was better than store-bought. To settle the debate amongst friends, we did a blind taste test with some random people! We logged everyone’s ratings for each pizza type and then ran a t-test. Turns out folks preferred my friend’s pizza by a slim margin! That little analysis added weight to an otherwise friendly argument!
In summary, using a t-test can save researchers from jumping to hasty conclusions based solely on observation. It provides clarity amid confusion and gives scientific claims stronger backing through statistical significance. The next time someone talks about data analysis in research, remember this handy tool—the good ol’ t-test—and appreciate how numbers work behind those conclusions!
So, let’s talk about T tests, shall we? You might’ve come across this term if you’ve dabbled in science or even just sat through a statistics class. It sounds a bit fancy, but it’s really just a way to help researchers understand if the differences they see in their data are legit or if they’re just flukes.
I remember back when I was working on a project for school. We were testing out different fertilizers on plants and, wow, the results were all over the place! Some plants thrived while others looked like they’d seen better days. It was confusing—like trying to solve a mystery without any clues. That’s where my trusty T test came into play. It helped me figure out whether the growth we observed was actually due to the type of fertilizer or just random chance.
Now, how does a T test work? Well, imagine you have two groups—let’s say group A with one type of fertilizer and group B with another. The T test helps you compare the average growth between these two groups to see if there’s enough evidence to say one is better than the other. If your results show a significant difference, you can be more confident that it wasn’t just luck that made one group perform better.
But here’s where it gets interesting: using T tests isn’t always straightforward. You need to meet some assumptions for them to work properly—like having your data follow a normal distribution (which is basically saying that most things should be average and only a few should be extreme). Sometimes researchers skip over these details because they’re eager to get their results out there! And hey, who hasn’t rushed through something sometimes?
It’s kind of wild when you think about how one little statistical test can impact scientific conclusions! Good data analysis can lead to breakthroughs in various fields—from medicine developing new treatments to environmental science helping us understand climate change patterns.
At the end of the day, T tests are just one tool among many in scientific research and data analysis. They help make sense of numbers and provide clarity amidst chaos—kind of like finding that missing puzzle piece after flipping over every piece in frustration! So next time you hear someone mention T tests in research, you’ll know it’s all about making decisions based on solid evidence rather than guessing what works best. Isn’t that reassuring?