So, picture this. You’re sitting in a café, enjoying a latte, and your friend casually mentions they’re working on their thesis. They start throwing around terms like “degrees of freedom” and “Student’s T distribution.” You nod along, pretending to understand until you’re left wondering if they just joined a secret math club!
Honestly, the whole idea of using statistical tables can feel like stepping into a foreign land where everyone speaks in symbols and numbers. But the thing is, these tools can actually make your research so much clearer.
Whether you’re crunching numbers for school or trying to figure out how reliable your findings are, the Student T distribution is pretty handy. Trust me; it’s not as scary as it sounds! In fact, it’s like that friend who always has your back when the chips are down—like when you need to make sense of data that’s too tricky for basic stats.
So let’s break it down together. No stress, just some fun with stats!
Understanding the Student’s t-Distribution: Key Scenarios for Application in Scientific Research
The Student’s t-distribution is a really handy statistical tool that comes into play when you’re dealing with small sample sizes. Imagine you’re in a lab, trying to figure out the average height of some plants you just grew from seeds. You’ve only got a tiny number of plants to measure—maybe just 10 or 15. Here’s where the t-distribution can help, giving you more accurate estimates in your calculations than the standard normal distribution.
So, what’s the deal with the t-distribution? Well, it’s shaped kind of like a bell curve, but it has heavier tails. This means that it allows for more variability in your data, which is super important when your sample size is small and your data might be less reliable. The heavier tails are there to account for that extra uncertainty.
Key scenarios where you’d use the Student’s t-distribution include:
Think about an example: Suppose you’re studying whether students perform better after studying with music. You gather a sample of 15 students and record their test scores. Since you’ve got fewer than 30 scores, using the normal distribution might lead you astray because it doesn’t adjust for the variability well enough. The t-distribution helps you account for that.
Now let’s chat about those degrees of freedom. It sounds technical but stay with me! In simple terms, degrees of freedom (df) are calculated as your sample size minus one (n-1). So if you’ve measured those 15 students’ scores, you’d have about 14 degrees of freedom. This number is crucial because it determines which specific t-distribution you’ll use: a higher df gets you closer to a normal distribution.
Another thing to note is how we find critical values in our analysis. There are tables available or software tools to help with this! These critical values assist in determining whether your findings are statistically significant or not.
And then there’s the real-world application: scientists often run experiments to validate theories or claims based on limited samples—like testing new medications or educational methods on small groups before broadening their studies.
So remember: whenever you’re working with smaller samples and facing uncertainty in averages being drawn from them—likely situations you’ll encounter—you’ll want to reach for that Student’s t-distribution. It’s like having an umbrella ready for unpredictable weather; it just makes sense!
Guidelines for Using the Student’s T Table Over the Z Table in Statistical Analysis
So you’re diving into statistics, huh? Well, let’s talk about the Student’s T table and when to use it over the Z table. At first glance, both tables seem like they do the same job—they help you find critical values for hypothesis testing. But there are some differences, and knowing those can really help you out.
First off, what’s the deal with the Student’s T distribution? It’s a bit different from the normal distribution we usually think about. The T distribution is more spread out and has fatter tails. This means it’s better at handling situations where you have a small sample size—like if you’re working with less than 30 data points. When your sample is small and you’re not sure about the population standard deviation, the T table is your go-to.
Here are a few key moments to think about:
- Small Samples: If your sample size (let’s say ‘n’) is less than 30, seriously consider using the Student’s T table. That’s where it shines!
- Population Standard Deviation Unknown: If you don’t know the true population standard deviation (which is often), then again—bring in that T table!
- Narrowing Down Variability: The T distribution accounts for more variability which is super helpful when dealing with small samples.
- Larger Samples: Once your sample size hits 30 or more, using the Z table becomes okay since larger samples tend to follow normality better.
A quick example might help clarify this stuff: Imagine you’re conducting an experiment on plant growth with only 15 plants. You measure their height and calculate their average and standard deviation. Since you’re dealing with a small group of plants (n = 15) and probably don’t know how all plants grow in general (population SD), you should whip out that Student’s T table to find your critical value.
The beauty of using a statistical method correctly? It allows us to draw meaningful conclusions without fishing in murky waters! The takeaway here? When in doubt or when working with smaller samples where uncertainties lurk around every corner—you’ll want that Student’s T table by your side.
In summary, just remember: use T when samples are small or unknowns abound; lean on Z for larger samples and known standards. Happy analyzing!
Understanding the t-Distribution: Essential Insights for Researchers in Scientific Studies
The t-distribution is a really cool concept that’s super useful in scientific research, especially when you’re dealing with small sample sizes. If you ever found yourself scratching your head over it, you’re not alone! So let’s break it down.
Imagine you’re trying to understand the average height of all the students in your school. You can’t measure everyone, right? So you take a smaller sample instead. This is where the t-distribution comes into play. Unlike the standard normal distribution, which has its cool bells and whistles with large samples, the t-distribution helps you estimate means and confidence intervals when your sample size is not big enough.
Now, why is this important? Well, for small groups, variations can make a big difference in results. The t-distribution accounts for that by being a bit wider and having heavier tails. This means it gives more room for error, so to speak. It’s like having a safety net when you might be precariously suspended over data cliffs!
So let’s get into some key points about how this all works:
- Degrees of Freedom: This sounds fancy but it’s just a way of saying how many independent values there are in your dataset after accounting for any constraints. For example, if you have 10 data points and calculate their average, you have 9 degrees of freedom (10 – 1).
- T-values: These help you see how far your sample mean is from the population mean—now that’s neat! Higher absolute t-values indicate greater group differences.
- T-tables: If you’ve ever seen one of those tables with numbers and thought they looked like ancient scrolls—you’re right! They basically tell researchers the critical values of t based on degrees of freedom for given confidence levels. For instance, if your degrees of freedom are 9 and you’re looking for a confidence level of 95%, you’d find that magic number in the table to guide your analysis.
You might find that using these tables can feel like playing detective. You’re piecing together clues about what your data is telling you compared to what’s expected in a larger group!
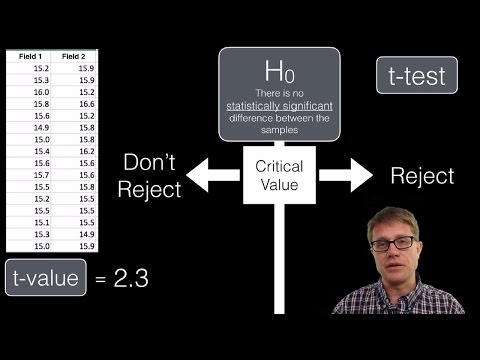
A common scenario involves comparing two sample means—let’s say comparing test scores between two classes. Using a t-test helps determine if their averages differ significantly by employing that trusty t-distribution table.
The takeaway here? Understanding the t-distribution can really enhance how researchers interpret their results when working with smaller datasets. It adds that extra layer of reliability and gives confidence when making claims based on limited information.
So next time you’re crunching numbers or preparing research findings, remember: using the Student’s t-distribution isn’t just smart—it’s essential for drawing solid conclusions from small samples!
Using the Student T Distribution Table, now that’s a handy tool in scientific research. You might be thinking, what’s the big deal with this table? Well, let’s break it down.
First off, if you’re working with smaller sample sizes—like fewer than 30—you’ll definitely want to get cozy with this distribution. It helps you understand how your sample results compare to what you’d expect from a normal population. Picture this: you’re conducting an experiment on plant growth and you’ve only got five little seedlings to work with. The data you collect is super valuable, but it’s also kind of shaky because of that small number. That’s where the T distribution swoops in like a superhero to save your analysis!
The T distribution looks pretty much like a normal distribution but has heavier tails. This means it accounts for more variability in those tiny samples. So when you’re calculating confidence intervals or conducting hypothesis tests, using the T table gives you a better idea of where your true mean might lie.
I remember when I first encountered this in my stats class—it felt like stepping into a foggy forest. I had no clue how these numbers related to my little experiments and all those formulas seemed overwhelming at first! But as I kept looking at examples and playing around with some results, everything began to click.
You know how it feels when you knock on someone’s door and they unexpectedly swing it wide open? That sense of clarity can be just as exhilarating when understanding something complex like the T distribution! You start seeing its relevance everywhere—in projects from psychology papers to biology experiments.
So, yeah, using the Student T Distribution Table can feel daunting at first. But once you’ve got it down, it’s like having this secret weapon in your research toolbox. It enhances your confidence in interpreting data and assures you that even small samples can tell important stories! And honestly, who doesn’t love feeling empowered by numbers?