So, picture this: you’re at a party, right? Everyone’s buzzing about their latest fitness routines. Then, someone claims that their new workout is way better than old-school jogging. The room goes silent. How can we know for sure which one’s really working?
That’s where something called the Paired T Test swoops in like a superhero! 🤓 It’s not just a fancy term from your high school math class; it’s a cool way researchers figure out if changes they see in data are real or just, well, random noise.
This test is super handy when you’re comparing two sets of related data points—like measuring your sprint time before and after trying that new training plan. You know how sometimes your results can feel like they’re all over the place? Well, the Paired T Test helps cut through that chaos and gives us some clarity.
Basically, it’s about making meaning out of numbers and figuring out what really works. So let’s dive into this world together! You ready?
Understanding the Paired T-Test: A Key Statistical Tool in Scientific Research
The paired t-test is one of those nifty tools in statistics that can make your life a lot easier when you’re analyzing data. Basically, it helps you determine if there’s a significant difference between two related groups. It’s like comparing the same group of friends before and after a fun night out at the bowling alley to see if their scores improved!
So, when do you want to use it? Think about scenarios where you have two sets of related data. For instance, let’s say you’re testing a new drug on patients and measuring some health outcome before and after treatment. You want to know whether the treatment had an effect, right? That’s where this test steps in.
Why use a paired t-test? Well, it accounts for variability between individuals by focusing on differences within pairs. Instead of looking at each group’s average separately, you compare the averages of those differences. This makes it more powerful when evaluating changes because it reduces random noise.
- Pairs of samples: You need sets that are linked in some way.
- Normal distribution: The differences should ideally follow a normal distribution.
- Scale of measurement: Your data should be continuous.
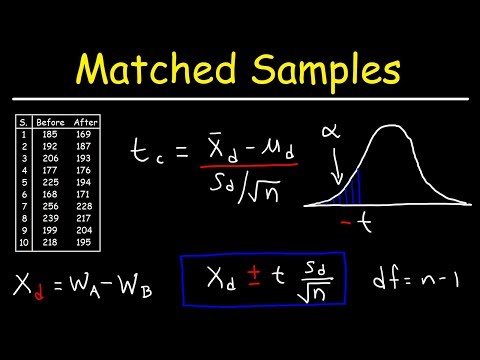
Now, let’s break down how you actually conduct this test. First off, you calculate the difference between each pair of observations—like how much better people scored after the fun night out! Then, you’d find the average of these differences and divide it by the standard deviation of those differences while adjusting for sample size.
To sum things up with an example: Let’s say you’ve got five friends who bowl twice—once before some coaching and once after—here’s how you’d set things up:
– Friend 1: Before = 100, After = 120 (Difference = 20)
– Friend 2: Before = 95, After = 105 (Difference = 10)
– Friend 3: Before = 110, After = 130 (Difference = 20)
– Friend 4: Before = 85, After = 90 (Difference = 5)
– Friend 5: Before = 80, After = 100 (Difference = 20)
You’d sum these differences up and see if that change is statistically significant or just due to chance.
And what does “statistically significant” mean? It’s that moment when your data shows something real is happening instead of just random luck. If your calculated t-value exceeds a critical value from statistical tables based on confidence levels (like p
Mastering the Interpretation of T-Test Results in Scientific Research: A Comprehensive Guide
The t-test is one of those magical tools in statistics that can help you figure out if two groups are really different from each other. And when it comes to the paired t-test, it’s particularly useful when you’re looking at the same subjects under different conditions. Like, imagine testing the blood pressure of a group of people before and after they meditate for a month. Pretty neat, right?
So, let’s break down how you can interpret the results of a paired t-test without getting lost in all that statistical jargon.
First off, you need to know what the paired t-test actually measures. Basically, it compares the means of two related groups. The null hypothesis says there’s no difference between those means, while the alternative hypothesis suggests there is one. If your results indicate a significant difference, you’ll reject that null hypothesis.
When analyzing your results, you’ll usually get three main outputs: the t-value, degrees of freedom (df), and p-value. Let’s unpack these:
Now, suppose after performing your test on that meditation data you found a p-value of 0.03. That’s significant! You’d conclude that meditation likely affected blood pressure levels—people’s systolic pressures have been reduced significantly.
But wait! Just because it’s statistically significant doesn’t mean it’s practically important. Make sure to look at things like effect size—it tells you how meaningful or impactful that difference really is in real-world terms.
Also, remember to check for assumptions before jumping into conclusions with your paired t-test:
What happens if assumptions aren’t met? Well, there are non-parametric alternatives like the Wilcoxon signed-rank test which can rescue your analysis if needed!
Interpreting results isn’t just about crunching numbers; it involves context too! Think about who participated in your study and what biases might creep into their responses because human behavior can be unpredictable!
So as you’re going through this process—stay curious! Look beyond just numbers and statistics; think about what those differences mean for real people out there living their lives every day.
It’s fascinating stuff when we step back and look at how science helps us understand ourselves better!
ANOVA vs Paired T-Test: Choosing the Right Statistical Analysis in Scientific Research
So, let’s talk about two common methods used in statistics: ANOVA and the Paired T-Test. You’ll see these pop up a lot in scientific research, and honestly, knowing when to use each one can make a big difference.
First off, what’s the basic idea? Both of these tests are designed to compare groups, but they do it in different ways. The paired t-test is like a personal investigator—it looks at two related samples. Imagine measuring the same group of students’ test scores before and after some special tutoring. That’s where the paired t-test shines because you have two sets of scores that are connected.
On the other hand, ANOVA (which stands for Analysis of Variance) is kind of like throwing a big party for all your data sets. It helps you compare three or more groups at once. So, if you wanted to see how different study methods affect test scores across three classrooms, ANOVA would be your go-to.
Now let’s get into some nitty-gritty details.
When to Use a Paired T-Test:
- Two Related Samples: As mentioned before, this method is perfect when you have two sets from the same group—like pre-test and post-test scores.
- Normal Distribution: The data should be roughly normally distributed. So if your data looks more like a jumbled mess than a bell curve, then this might not be ideal.
- Smaller Sample Sizes: It often works well with smaller groups; think fewer than 30 subjects.
And then there’s ANOVA…
When to Use ANOVA:
- Three or More Groups: If you’re comparing multiple groups—like looking at results from three different treatments—ANOVA is essential here.
- Treatment Effects: It helps determine if at least one group mean is significantly different from another group mean.
- No Assumption of Pairing: Unlike paired t-tests where samples need pairing, ANOVA lets each group be independent from others.
Now here’s an important point: while both tests can tell you if there are differences among groups, they don’t tell you *where* those differences lie! That’s why if ANOVA gives significant results, you’d often follow it up with post-hoc tests (like Tukey’s HSD) to see which specific means are different.
Here’s something interesting: I remember working on a project once where we were testing the effects of caffeine on reaction times across multiple age groups. Using ANOVA allowed us to quickly see whether age made any difference in performance while maintaining clarity across all our different sample sizes.
And hey—you might wonder about assumptions too! Both tests come with their own assumptions about data normality and variance homogeneity. Violating these can lead to funky results, so it pays off to check!
In summary:
– If you’re dealing with two related samples—the paired t-test should be your buddy.
– On the flip side, when you’re juggling three or more independent samples—ANOVA takes center stage.
So next time you’re crunching numbers in scientific research, knowing which statistical analysis suits your data best will save you time and give more reliable results! Pretty neat stuff!
So, you know when you’re trying to figure out if two things are really different from each other? Like maybe you want to see if a new kind of coffee is stronger than the old one? That’s where something called a paired t-test comes into play. It’s this nifty tool in statistics that helps us compare two sets of related data.
Imagine a friend of mine, Sarah. She swears by her morning coffee ritual. One day, she decided to test two different brews—one from her favorite local shop and another from a trendy new place. She wanted to see if she felt more energized after sipping on the new brew. So, she recorded her energy levels before and after drinking each type for a week. By the end of it, Sarah had all these numbers about how she felt with each coffee.
Here’s where the paired t-test shines! It takes those paired observations—energy levels before and after trying each type—and crunches the numbers for you. Basically, it tells you whether any difference in energy was just a fluke or if it really mattered statistically.
Now, when doing this test, researchers usually look at factors like mean differences and variances. What they’re after is whether the average change (let’s say Sarah’s energy boost) is significant enough to claim that one coffee really is better than another. But here’s the catch: even a statistically significant result doesn’t always mean it matters in real life! Sometimes numbers can be misleading or exaggerated.
In Sarah’s case, maybe her love for one specific roast made her enjoy that cup more than just what the stats showed. This whole experience reminds us that while statistical tools like the paired t-test are super handy for data interpretation, they’re just a piece of the puzzle. Context matters—you can’t just throw numbers around without thinking about what they actually mean in our everyday lives.
So next time you hear about someone using a paired t-test or any fancy statistical method, remember: it’s not just about getting results; it’s also about understanding what those results tell us in reality!