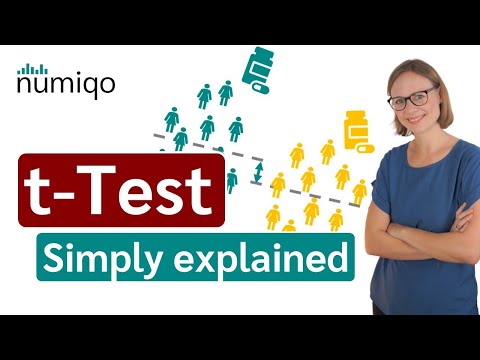
You know that moment when you’re trying to figure out if your new recipe is better than your grandma’s famous pie? Well, scientists have a fancy way of doing just that with their studies. It’s called a T test, and honestly, it’s like the detective work of statistics.
Imagine you’ve got two groups: one that ate the pie and one that didn’t. How do you know if the pie made folks happier? That’s where T tests come in.
They help researchers compare groups and sift through data like pros. Seriously, it’s pretty neat how they can tell if something really makes a difference or if it’s just random chance—kind of like finding out if your grandma’s secret ingredient is love or just sugar!
So, let’s unpack this mysterious little tool. You’ll see how different types of T tests work and why they’re super handy in scientific research!
Exploring the Different Types of T-Tests: Applications and Uses in Scientific Research
T-tests are statistical methods used to determine if there are significant differences between the means of two groups. Sounds simple, right? Well, there’s actually a bit more to it than that! They play a critical role in scientific research across various fields—like psychology, medicine, and biology.
First off, let’s talk about the **two-sample t-test**. This is used when you want to compare the means of two independent groups. For example, think about researchers studying the effects of a new medication on blood pressure. They might have one group taking the drug and another group receiving a placebo. The t-test helps figure out if any observed differences in blood pressure between these two groups are statistically significant. You follow me?
Then we have the **paired t-test**. This one’s interesting because it’s used when you’re looking at related groups—like measuring something before and after an intervention on the same subjects. Picture this: A team of scientists wants to see if their new diet program affects weight loss. They weigh participants before starting the diet and then again after three months. The paired t-test would help identify whether any weight change is meaningful or just random variation.
Another one to consider is the **one-sample t-test**. It’s like comparing your average score in a game with some known standard—say, if you’re trying to see if your average exam score is different from a class average of 75%. You’d use this test to understand if your score stands out or not.
And what about assumptions? Well, for all types of t-tests, there are some basic conditions you’ve gotta check: Like normality (the data should be approximately normally distributed), independence (especially important for two-sample tests), and variance homogeneity (the variances in both groups being compared should be roughly equal).
But here’s where things get a little tricky: If those assumptions aren’t met, using a t-test can lead to misleading results! Some scientists might turn towards non-parametric tests like Mann-Whitney U test instead when they find their data isn’t meeting these requirements.
So why care about all this? Because understanding how different types of tests fit specific research needs is crucial! Whether it’s analyzing clinical trial results or comparing test scores across different student populations—it gives valuable insights.
In summary:
- Two-sample t-test: Compares means of two independent groups.
- Paired t-test: Looks at changes within related samples.
- One-sample t-test: Tests whether mean differs from a known value.
You can see that knowing which type of t-test to use is essential for solid research outcomes! Each type offers its unique insights depending on your study design and question at hand.
Understanding the Most Commonly Used T-Test in Scientific Research: A Comprehensive Guide
So, you’re curious about t-tests, huh? Well, let’s break it down. T-tests are a fundamental tool in statistics used to determine if there are significant differences between the means of two groups. They’re super handy in scientific research when you’re trying to figure out whether the effects of a treatment or an intervention are real or just random noise.
First off, there are a few common types of t-tests. Each one serves its purpose depending on what you’re comparing. Here’s a little rundown for you:
- Independent t-test: This one is used when you’re comparing two different groups that aren’t related in any way. Think about testing a new drug on one group and giving another group a placebo. You want to see if the drug had an actual effect.
- Paired t-test: Now, this is when you have two sets of related data points. Imagine before-and-after measurements—like tracking weight loss before and after someone follows a diet plan. The same people are measured both times, so you’d use this test.
- One-sample t-test: This test checks whether the mean of a single group differs from a known value or population mean. Let’s say you want to know if your class average exam score is different from the national average; this comes into play.
Next up, let’s talk about when to use these tests and why they matter in research. Basically, any time you’re looking to make conclusions based on sample data—like those experiments we do in labs—you need to understand whether your results are not just due to chance.
For instance, I remember going through my stats course back in college and feeling lost when we hit this topic! The professor made us conduct our own little experiment comparing heights of plants grown with different fertilizers. We had tons of data points but had no clue how to interpret them until he explained how the independent t-test was our best option for finding out if one fertilizer actually made plants grow taller than another.
Now, since we’re diving into it, let’s mention some assumptions that come along with using these tests:
- The samples should be drawn from normally distributed populations—this basically means your data should follow that lovely bell curve pattern.
- The variances between groups should ideally be equal; otherwise, it might mess with your results (there’s something called Levene’s test that helps check this).
- The samples should be independent for independent t-tests; no overlap between groups allowed!
And then there’s the whole significance level thing—you usually set it at 0.05 (or 5%). That means if your p-value is below that threshold after running your test, you can reject the null hypothesis and say “hey! There *is* something happening here!”
It’s pretty cool stuff because once you get it down pat, it opens up a world where you can critically evaluate research reports and studies instead of just taking everything at face value.
In saying all that: statistical analysis may seem daunting at first glance but understanding these concepts really equips you with skills to dig deeper into scientific inquiries and challenges out there! Just remember: practice makes perfect—and trust me; those t-tests become second nature with a bit of time and effort!
Comprehensive Guide to T-Tests: Types, Applications, and Scientific Insights (PDF)
T-tests are statistical tools that help you compare the means of two groups to see if they’re significantly different from each other. It’s like checking if two students, who both claim to be the fastest runners in their class, can back it up with their actual times. You gather the data and run a t-test to figure out if one is truly faster than the other or if their performances are just similar enough to be considered equal.
Now, there are two main types of T-tests: the **independent samples t-test** and the **paired samples t-test**.
- Independent Samples T-Test: This is used when you have two separate groups. Imagine you want to see if men and women have different average heights. You measure a group of men and a separate group of women, then run this test.
- Paired Samples T-Test: This one’s a bit different because it compares two groups that are somehow related or matched. For example, say you want to measure how much a group of people improves their fitness after a specific training program. You would take measurements before and after the program for the same people.
But wait, there’s more! There’s also a variant called the **one-sample t-test**, which checks if the mean of a single group differs from a known value—like testing whether your class’s average score on some exam is above 75%.
So what do these tests assume? Well, they assume that your data follows roughly normal distribution—think bell-shaped curve—and that variances between your groups are similar. But don’t sweat it! If you’re working with large enough samples (typically over 30), these assumptions become less crucial.
When you get your results, you’ll often look at what’s called the **p-value**. If it’s less than 0.05 (that’s your usual cutoff), it usually means there’s enough evidence to say that there’s a significant difference between your groups—like proving one runner is actually faster than another!
In real-world scenarios, t-tests can be super helpful in fields like education or medicine. Imagine researchers evaluating whether new teaching methods improve student performance compared to traditional ones: independent samples t-tests come into play here! Or consider health studies analyzing patient outcomes before and after treatment: that’s where paired samples tests shine.
It’s like being a detective but with numbers instead of clues! You gather evidence from your data and use these tests as tools to uncover hidden truths about relationships between variables. So next time you’re curious about differences in behaviors or outcomes between groups, remember that t-tests might just be your go-to method for unraveling those mysteries!
So, let’s chat about t-tests. You know, those nifty little stats tools that researchers love to use? They’re like the Swiss army knife in the toolbox of scientific analysis. You might be thinking, “What on Earth is a t-test?” Well, imagine you and your buddy are arguing about which flavor of ice cream is better – chocolate or vanilla. The t-test helps you figure out if there’s actually a significant difference between how much people prefer one over the other.
Now, there are different types of t-tests, each serving its purpose like different ice cream flavors in a shop. The most common one is the independent samples t-test. It’s used when you have two separate groups—like, let’s say you have one group that trained for a marathon and another that didn’t. You want to see if their running times are different. It tells you if one group really did perform differently from the other.
Then there’s the paired sample t-test. This one’s like a soul mate of sorts since it’s all about comparing two related groups. Imagine before-and-after scenarios in an experiment: like measuring weight loss before and after a diet program with the same group of people. It helps determine if there was any real change due to something specific.
And we can’t forget about the single-sample t-test! This one checks whether the mean of your sample is different from some known value—like testing if your class’s average score on a math test is significantly different from the national average. Super handy for when you’re trying to showcase your genius (or lack thereof).
I remember when I first encountered these tests during my stats class; I was totally overwhelmed by all those numbers and formulas floating around in my head. But then it hit me: these tests are more than just math—they’re a way to make sense of observations we see around us! It felt kind of magical realizing that behind every experiment or study there’s this tool providing clarity and understanding.
In science, whether you’re tossing ice cream flavors at each other or experimenting with medicine, knowing which type of t-test to use can make all the difference. It’s not just about crunching numbers; it’s about making informed decisions based on data that matters—and that is pretty cool, don’t you think? All in all, while they might seem like small pieces in vast research puzzles, those little t-tests carry quite a load in helping us understand our world better!