You know that moment when you’re in a group chat, and everyone’s debating which pizza topping reigns supreme? Pineapple lovers face off against the pepperoni crew, and it gets intense. All of a sudden, you find yourself wanting to throw out some stats to defend your slice!
Well, what if I told you there’s a fancy way to compare two groups without all the drama? That’s where the Two Proportion Z Test comes in. It’s not nearly as scary as it sounds. Seriously! You could even use it to settle that pineapple on pizza debate with a bit of math magic.
So let’s break it down. What does it actually mean to test two groups? And why should you care about proportions anyway? Grab your favorite snack, and let’s figure it out together!
Understanding the Z-Test: A Statistical Approach to Comparing Two Samples in Scientific Research
Sure thing! Let’s break down the Z-Test, particularly focusing on the Two Proportion Z Test, which is a way to compare two samples, like two groups in scientific research. You know, it’s that time when researchers want to see if there’s a significant difference between two proportions or percentages.
So, imagine you’re running a study to check if more people prefer pizza over tacos. You survey 100 folks and find that 70 grab pizza while 30 go for tacos. Then you do another survey in a different neighborhood with 200 people and see that 110 prefer pizza and 90 like tacos. Now, the question is: is this difference just due to random chance or is it legit?
The Z-Test comes into play here. Basically, it helps you figure out whether those differences between your two groups are statistically significant.
To understand how this works:
- The Samples: You need two samples (like our pizza and taco lovers). These should be independent—that means what happens in one sample doesn’t affect the other.
- The Proportions: Calculate the proportions of each group. For our example, in the first group (Group A), it’s 70/100 = 0.7 for pizza lovers; in Group B it’s 110/200 = 0.55 for pizza lovers.
- Null Hypothesis: This is like your starting point where you assume there’s no difference at all between your two groups’ preferences.
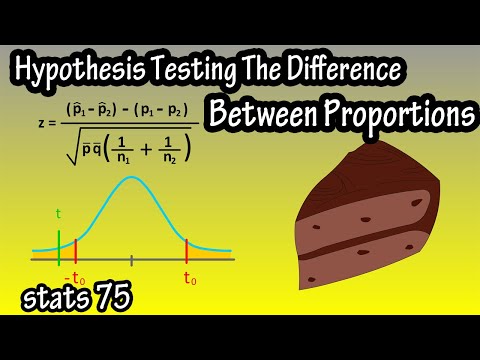
- The Formula: With everything set up, you can use the Z-Test formula: Z = (p1 – p2) / sqrt(p(1 – p)(1/n1 + 1/n2)), where p is the combined proportion from both samples.
Now let’s break down what all this means:
– **p1** refers to the proportion from your first sample; let’s say it’s 0.7.
– **p2** is from your second sample; that’s 0.55.
– **n1** and **n2** are just your sample sizes—100 and 200 respectively.
– The combined proportion (p) is calculated by adding up successes from both groups (70 + 110) divided by total observations (100 + 200), which gives us about 0.63.
Once you’ve plugged everything into that formula, you’ll get a number—this is your Z value.
Now comes the exciting part! You’ll look up this value on a standard normal distribution table to see if it falls into a certain range that we consider “significant.” If it does? Bam! There’s evidence that there really *is* a difference between how folks feel about pizza versus tacos.
In Practice: Say you get a Z score of -2.5 after calculating everything out. If you’re using a traditional significance level of .05, you’d check against critical values for one-tailed or two-tailed tests depending on what you’re doing.
If your score falls outside those critical values? You’ve got something interesting going on worth exploring further!
And just like that—you’ve compared two groups using statistical methods! It’s pretty neat how numbers can help clarify things we’re curious about in real life scenarios.
So next time someone asks if everyone really likes pizza more than tacos? Well, now you’ve got some statistical muscle behind that claim! It’s amazing how math can give us insights into everyday debates—whether at dinner with friends or in research labs across the world!
Understanding the Z-Test: A Statistical Method for Comparing Two Percentages in Scientific Research
So, let’s chat about the Z-test, specifically when you’re looking to compare two percentages. This is known as the Two Proportion Z Test, and it’s super handy in scientific research. Imagine you’re a researcher trying to find out if two different groups react differently to a certain treatment. The beauty of this test is that it gives you a way to see if the differences you observe are statistically significant or just random chance.
First off, what’s a Z-test? Well, it’s a type of statistical test that helps you figure out the probability that two sets of data come from the same distribution. In our case, we’re comparing two proportions—like how many people responded positively in Group A versus Group B.
Here’s how it works in simple terms:
- Sample Size: You start by collecting data from your two groups. Let’s say you have 100 patients in each group.
- Successes: Next, you calculate how many of them had positive outcomes. Maybe 30 out of 100 in Group A and 20 out of 100 in Group B.
- Proportions: Now you find the proportions: Group A would have a success rate of 0.30 (30%) and Group B would be at 0.20 (20%).
But here’s where it gets interesting—just having these numbers isn’t enough! You want to know if this difference actually means something or if it just popped up by coincidence.
To do this, you’ll need a formula for the Two Proportion Z Test:
Z = (p1 – p2) / sqrt(p*(1-p)*(1/n1 + 1/n2))
Whoa! It looks complicated but hang on for a sec. Here’s what all those symbols mean:
– **p1** and **p2** are your sample proportions (0.30 and 0.20).
– **n1** and **n2** are your sample sizes (both 100).
– **p** is the pooled proportion calculated as [(x1 + x2) / (n1 + n2)], where x is the number of successes.
Now you can plug your values into this formula! Once you’ve punched those numbers into your calculator—don’t forget that calculator doesn’t like division too much—you’ll get your Z value.
So what do you do with that Z value? You compare it against critical values from the standard normal distribution to see if it falls within the range which indicates statistical significance—a fancy way of saying there’s a real difference between your groups!
For example:
– If your calculated Z value is more than 1.96 or less than -1.96 for a significance level of 0.05, then congratulations! You’ve found significant evidence that there’s indeed a difference between Group A and Group B.
It’s kind of like being on an adventure with statistics where you solve puzzles using numbers!
Now here comes an interesting part; I remember working with some colleagues who were studying whether diet affects cholesterol levels across different age groups—super important stuff! One group was younger; another older flossers—they got their results back, ran their Two Proportion Z Test, and boom! They discovered that diet did make a considerable difference in cholesterol levels among younger folks but not so much for older individuals.
This not only highlighted dietary impacts but also helped tweak future studies based on age-related responses—a real-life application showing how powerful this test can be when used correctly!
In short: The Two Proportion Z Test helps researchers compare percentages between two groups effectively by letting them determine whether observed differences are statistically significant or just random flukes. Remember though: good data collection methods and appropriate sample sizes are key players here too!
So next time you’re diving into some research involving comparisons between two percentages, think about reaching for that Two Proportion Z Test tool—it might be just what you need to crack the code!
Understanding the Applications of Chi-Square and Two-Proportion Z-Test in Scientific Research
So, let’s talk about the Chi-Square test and the Two-Proportion Z-Test. These two stats tools are super handy for scientists when they want to compare groups. Whether you’re testing a new drug or checking if students prefer online classes versus in-person ones, these tests can help you figure things out.
First off, the Chi-Square test. This one is great when you have categorical data. You know, like yes/no answers or survey responses like “Do you like chocolate?” with options of “yes,” “no,” and “maybe.” The idea is that it helps to see if there’s a relationship between two variables in a sample. So, let’s say you want to check if there’s a difference in chocolate preference between men and women. You collect responses from both groups and then use the Chi-Square test to crunch those numbers.
Here’s how it works:
- The data gets organized into something called a contingency table.
- You calculate the expected values for each category.
- Then, compare these expected values against your actual results.
- If there’s a big difference, it suggests that gender might influence chocolate preferences.
Now switching gears to the Two-Proportion Z-Test. This test is used when comparing two proportions directly. Imagine you’re curious whether more people prefer dark chocolate over milk chocolate. You survey 200 people and find out that 120 love dark chocolate while 80 prefer milk.
With this test:
- You set up your hypotheses: one for no difference (the null hypothesis) and one suggesting there is a difference (the alternative hypothesis).
- Next, you calculate the proportions for each group (like dark vs milk).
- You then figure out the standard error based on these proportions.
- The final step? Crunch those numbers and see if your calculated Z value tells you there’s a significant difference between those groups!
Both tests have their spots where they shine. The Chi-Square is perfect when you’re working with frequencies—like how many people picked each option—while the Two-Proportion Z-Test kicks in when you’re all about comparing percentages directly.
And here’s an interesting side note: using these tests isn’t just about getting numbers; they can really change how we view things in real life. For example, if researchers find that students perform better online than face-to-face during exams using these tests, it could lead to shifts in teaching strategies everywhere.
So basically, both of these statistical methods play crucial roles in scientific research by giving insights into relationships between categorical variables or differences between group proportions. They don’t just give us numbers; they help tell stories through data!
Alright, so you know how sometimes you just wanna compare two things? Like, which ice cream flavor is better: chocolate or vanilla? Or maybe you’re trying to see if two schools have similar success rates in a new reading program. That’s where something like the two-proportion Z test comes into play—sounds fancy, huh? But really, it’s just a tool that helps us figure out if there’s a significant difference between two groups when we’re looking at proportions.
Let’s say you’ve got one group of students using a new study app and another group just sticking to their old textbooks. You might want to find out if the app users are more likely to get better grades than those who don’t use it. So, first thing you do is collect your data. You’d see how many kids from each group scored well on their tests. It’s like counting how many people prefer chocolate over vanilla among your friends.
Now here’s the cool part: once you have those numbers, you can plug them into this two-proportion Z test formula. What it does is help calculate whether the differences you’re seeing are due to random chance or if they actually mean something. It gives you a Z-score and a p-value. Now don’t freak out; that’s just math talk for “hey, here’s how confident we can be about our results.” If your p-value is low—like below 0.05—it usually means there’s something going on worth paying attention to.
I remember back in high school when we did an experiment comparing soda preferences in our cafeteria. We had teams asking everyone about their favorite—Coke or Pepsi? At first glance, it seemed like most people went for Coke, but using a method similar to this test showed us that the difference wasn’t as huge as we thought after all! It was eye-opening and made me realize how data could change perceptions about what we think we know.
So, basically, the two-proportion Z test isn’t just numbers on a page; it’s about getting real insights into what’s happening in your world—whether that’s flavors of ice cream or educational strategies! It allows researchers (and curious minds) to make informed decisions based on actual stats rather than guesswork. And honestly? That kinda understanding can be powerful!