Alright, here’s a fun thought: imagine you’re trying to bake a cake, but every time you add an ingredient, the oven just kinda… shrugs. Sounds frustrating, right? Well, that’s kinda how enzymes work when they interact with substrates.
Anyway, enzymes are these little proteins that speed things up in our bodies. They’re like that friend who always makes the party more exciting but can also be a bit picky about what makes it fun.
So, have you ever heard of the Michaelis-Menten graph? It’s this cool way to visualize how enzymes do their thing, and trust me—it’s not as boring as it sounds! It actually tells us a lot about how quickly they’ll work depending on different conditions.
Stick around, and let’s see how we can wrap our heads around this funky graph that makes enzyme action crystal clear!
Understanding the Michaelis-Menten Plot: Key Insights into Enzyme Kinetics in Biochemistry
So, you might’ve stumbled upon the Michaelis-Menten plot when diving into the world of enzymes and biochemistry. It’s a super key concept that helps explain how enzymes work, sorta like a roadmap for understanding enzyme kinetics. Let’s break it down, shall we?
First off, what’s the deal with enzymes? Well, enzymes are basically proteins that speed up chemical reactions in our bodies. You can think of them as tiny machines that help everything run smoothly. Now, here’s where Michaelis and Menten come in. They were two scientists who came up with this important equation in the early 20th century to describe how enzymes interact with substrates—the stuff they’re acting on.
This is where you get to see how **the reaction rate changes with different substrate concentrations**. Imagine you’re at a pizza party; if there’s only one slice left but ten hungry friends, it’ll take a while to cut and share it! But if there are loads of slices, everyone gets fed quickly. The same principle applies here.
The **Michaelis-Menten equation** is usually written like this:
[ v = frac{{V_{max} cdot [S]}}{{K_m + [S]}} ]
Where:
- v = the rate of reaction
- [S] = concentration of substrate
- V_{max} = maximum rate of reaction (when all enzyme active sites are full)
- K_m = Michaelis constant (substrate concentration at half V_max)
Let’s chat about those variables for a sec. The **V_max** tells us the max efficiency an enzyme can achieve—kinda like the fastest your friend could ever chug soda if they really went for it! And then there’s **K_m**, which gives insight into how well an enzyme binds to its substrate; a low K_m means high affinity—it holds on tight.
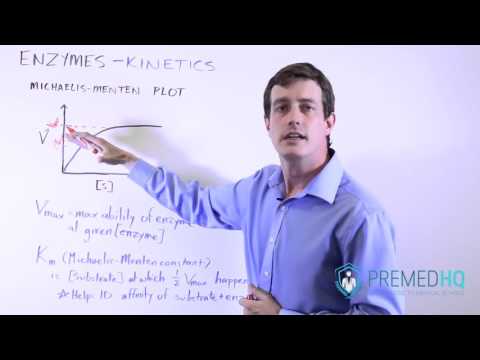
When you plot these values on a graph—so the x-axis is substrate concentration and the y-axis is reaction rate—it creates this nice curve called a hyperbola. At low substrate concentrations, small increases in substrate can lead to big jumps in reaction rate! But as you ramp up that substrate (like piling on more pizza), those increases start leveling off as you get closer to V_max.
Now picture your friend serving pizza again: they could hand out slices faster until they run out or hit their limit—it kinda flattens out after that!
Another neat thing about this plot is its practical applications. It helps scientists understand how drugs might interfere with enzymatic processes or even predict how fast they’ll react under different conditions. It’s wild to think that something so simple can have such big implications!
So there you have it—a little journey through enzyme kinetics via the Michaelis-Menten plot! Enzymes are like microscopic superheroes carrying out crucial tasks, and this graph gives us essential tools for understanding their powers better! Pretty cool stuff, right?
Mastering the Michaelis-Menten Graph: A Step-by-Step Guide for Biochemists
Alright, so let’s talk about the Michaelis-Menten graph. You know, it’s a pretty big deal in biochemistry, especially when you’re trying to wrap your head around enzyme kinetics. Basically, this graph helps visualize how enzymes work to convert substrates into products. And believe me, mastering it can seriously beef up your understanding of the whole process.
The Michaelis-Menten equation describes the rate of enzymatic reactions by looking at substrate concentration. It goes like this: V = (Vmax[S]) / (Km + [S]). So, what does that even mean? Well, here’s the gist:
- V: This is the rate of reaction.
- [S]: This represents the substrate concentration.
- Vmax: The maximum rate of reaction when the enzyme is fully saturated with substrate.
- Km: This is a constant that indicates how much substrate you need to reach half of Vmax. In other words, it’s a measure of enzyme affinity for its substrate.
When you plot this equation on a graph with [S] on the x-axis and V on the y-axis, you get that iconic hyperbolic curve. At low concentrations of substrate, the reaction rate increases sharply as more substrate means more collisions with enzyme molecules. But as you add more substrate and hit a point where all enzymes are occupied—boom—you level off at Vmax. It’s like trying to fit ten people in a car built for five; eventually, it just can’t go any faster!
A really cool thing about Km is its variability between different enzymes. You can think of it as an “affinity score.” A low Km means high affinity; your enzyme grabs that substrate tight! On the flip side, a high Km means it doesn’t hold onto that substrate so well—it needs more around to get going.
One thing I remember vividly from college was when we did an experiment measuring enzyme activity with various concentrations of substrates… The excitement in the lab as we saw our graphs come together was electric! That moment when our data finally matched theory—pure gold! And looking back now, I can appreciate how seeing those curves not only illustrated our findings but also made those abstract concepts feel way more tangible.
If you’re interested in really nailing down this graphing business, try creating some plots based on hypothetical data. Manipulate [S] and see how V changes—experiment with different Km values too! It’s all about getting familiar with those curves and what they represent in real-life scenarios.
The Michaelis-Menten graph isn’t just some academic exercise; it has real applications in drug design and understanding metabolic pathways too! Knowing how enzymes interact under various conditions helps researchers develop better pharmaceuticals or even tweak environmental factors for industrial processes!
In short, mastering this graph opens up a lot of doors for understanding biology at a finer level—and who doesn’t love peeling back layers to see what makes things tick? Just remember: practice makes perfect! Play around with data and visualize those reactions until you’re hitting all the right notes on that graph!
Understanding Uncompetitive Michaelis-Menten Kinetics: Insights into Enzyme Inhibition and Reaction Mechanisms
So, let’s chat about **uncompetitive Michaelis-Menten kinetics**. It sounds a bit intense, but stick with me. When we look at enzyme kinetics, the Michaelis-Menten model is one of the big players in understanding how enzymes work. You know how enzymes help speed up chemical reactions? Well, this model helps us figure out just *how* they do their thing.
Now, let’s break it down a bit more. First off, what are these **uncompetitive inhibitors**? Basically, they’re like those friends who only want to hang out when you’re doing something fun. They bind to the enzyme *only* when the substrate is already attached. This means that these inhibitors can’t really kick in until there’s some action happening.
When an uncompetitive inhibitor shows up, it binds to the enzyme-substrate complex rather than just colliding with the free enzyme—the one that’s ready to go. This binding changes how effectively the enzyme can turn that substrate into a product. And here’s where it gets interesting: both **Km** (the Michaelis constant) and **Vmax** (the maximum rate of reaction) go down because of this type of inhibition.
So why does this happen? Well, since the substrate is already bound when the inhibitor comes in, now you have an enzymatic side hustle going on! With the inhibitor stuck there, it’s like trying to run while carrying a backpack full of bricks: things get a lot slower and trickier.
To visualize what this looks like on that classic **Michaelis-Menten graph**, imagine plotting reaction rates against substrate concentrations. With uncompetitive inhibition:
1. The curve shifts downward but looks pretty similar because Vmax decreases.
2. Km also decreases since you’re kind of lowering the concentration of effective enzyme available for reaction.
What does all this mean? Basically, even if you pump more substrate in there, you still can’t regain your original reaction rate due to that pesky inhibitor hanging around.
An example might help cement this concept—pun intended! Picture a car racing on a track (that’s your enzyme). If some fans throw up barriers along part of that track only after the car starts racing (like our uncompetitive inhibitors), then even if we fuel up our car with more gas (adding more substrate), it can’t go faster because it still has those barriers slowing it down.
It’s super fascinating when you think about how this plays into real-life scenarios too! Uncompetitive inhibition can be important in drug design or understanding metabolic pathways where enzymes could be targets for treatment.
So yeah, uncompetitive Michaelis-Menten kinetics may seem like just another scientific term at first glance, but once you peel back those layers — it’s pretty cool how it helps us understand not just enzymes but also larger biochemical interactions. Keep your curiosity alive; there’s always more to learn!
Okay, so let’s chat about enzyme kinetics and this cool thing called the Michaelis-Menten graph. Now, enzymes are basically little helpers in our bodies that speed up all those chemical reactions we need to live. Think of them like super-efficient factory workers. They’re crucial for everything from digesting your food to creating energy.
Imagine you’re baking cookies, right? The recipe calls for flour, sugar, eggs… and then you have your helper—let’s say it’s your buddy who’s really fast at cracking eggs. The quicker they crack those eggs, the faster you can get to mixing it all up and putting it in the oven. That’s kind of how enzymes work—they help reactions happen quicker by reducing the time it takes to transform one thing into another.
Now, with enzyme kinetics, we wanna figure out just how well these little workers are doing their jobs under different conditions. This is where the Michaelis-Menten equation comes in. It’s like a recipe for understanding how an enzyme works at different concentrations of its substrate (which is what they act on). Picture a graph that shows how the speed of the reaction changes as you add more substrate. At first, increasing the substrate boosts that reaction speed—like how your cookie-making friend really kicks it into high gear when there are more eggs to crack.
But there’s a catch! As you keep adding substrate, there comes a point where your buddy can’t go any faster—they reach their limit because there are only so many hands available for cracking those eggs. That plateau on the graph represents this maximum speed—the Vmax—where adding more substrate just doesn’t help anymore because the enzymes are all busy working hard.
I remember my college days when I first encountered this graph during lab experiments. I could almost see light bulbs going off in my head as we plotted our data points and connected them into that familiar curved shape—one moment of pure excitement as I realized I was making sense of something so complex! It was like unveiling a piece of nature’s puzzle right before my eyes.
So anyway, looking at this graph isn’t just about numbers and lines; it’s about understanding life at a microscopic level. It tells us not only how fast these reactions happen but also helps scientists design drugs or improve processes in industries like brewing or biofuels.
In a nutshell, visualizing enzyme kinetics with that classic Michaelis-Menten curve opens up a whole new world where science feels alive and relevant—like watching magic unfold on paper! And honestly? That’s pretty inspiring if you ask me!